Dr Martin Juneau, M.D., FRCP
Cardiologue, directeur de l'Observatoire de la prévention de l'Institut de Cardiologie de Montréal. Professeur titulaire de clinique, Faculté de médecine de l'Université de Montréal. / Cardiologist and Director of Prevention Watch, Montreal Heart Institute. Clinical Professor, Faculty of Medicine, University of Montreal.
See all articlesOverview
- Food production is responsible for about 25% of the greenhouse gases emitted annually, with half of these GHGs coming from animal farming, mainly in the form of methane.
- The agricultural sector is also an important source of fine particles responsible for air pollution, with the majority of these pollutants coming from ammonia generated by livestock farming.
- Overall, a reduction in the consumption of animal products, particularly those from cattle farming, is therefore absolutely essential to limit global warming and improve air quality.
The latest report from the Intergovernmental Panel on Climate Change (IPCC) confirms that, if nothing is done, the constant build-up of greenhouse gases (GHG) in the atmosphere will cause temperatures to increase by more than 1.5ºC above pre-industrial levels over the next century, namely the target set by the Paris Agreement to minimize the negative effects of global warming. There is therefore an urgent need to drastically reduce the emission of these gases if we want to prevent the consequences of this warming, already visible today, from becoming out of control and causing an increase in the incidence of extreme climatic events (droughts, heat waves, hurricanes, forest fires), disrupting life on Earth (extinction of species, fall in agricultural yields, increase in infectious diseases, armed conflicts) and increasing the incidence of several diseases linked to excessive heat.
Carbon dioxide and other greenhouse gases
The main greenhouse gas is carbon dioxide (CO2), which now has a concentration of 417 ppm, about twice as much as in pre-industrial times. However, it should be noted that other gases, even if they are present in smaller quantities, also contribute to global warming. These gases, such as methane or certain molecules used for industrial purposes, capture heat in a much greater way than CO2 and therefore have a higher global warming potential (GWP) than CO2. For example, a tonne of methane has a GWP 28 times greater than a tonne of CO2 over a 100-year period, while the GWP of some industrial gases such as sulfur hexafluoride can reach almost 25,000 times that of CO2 (Table 1). In other words, even if many of these gases are present in minute quantities, on the order of a few parts per billion (10-9) or even per trillion (10–12), their emission is several times that of CO2 and therefore significantly contributes to warming.
Table 1. Global warming potential of various greenhouse gases.1 Values are for the year 2018, except for CO2 which is for 2020. Derived from the United States Environmental Protection Agency (EPA).2 Calculated for a 100-year period. From Greenhouse Gas Protocol. *ppm (part per million or 10-6); **ppb (part per billion or 10-9); ***ppt (part per trillion or 10–12).
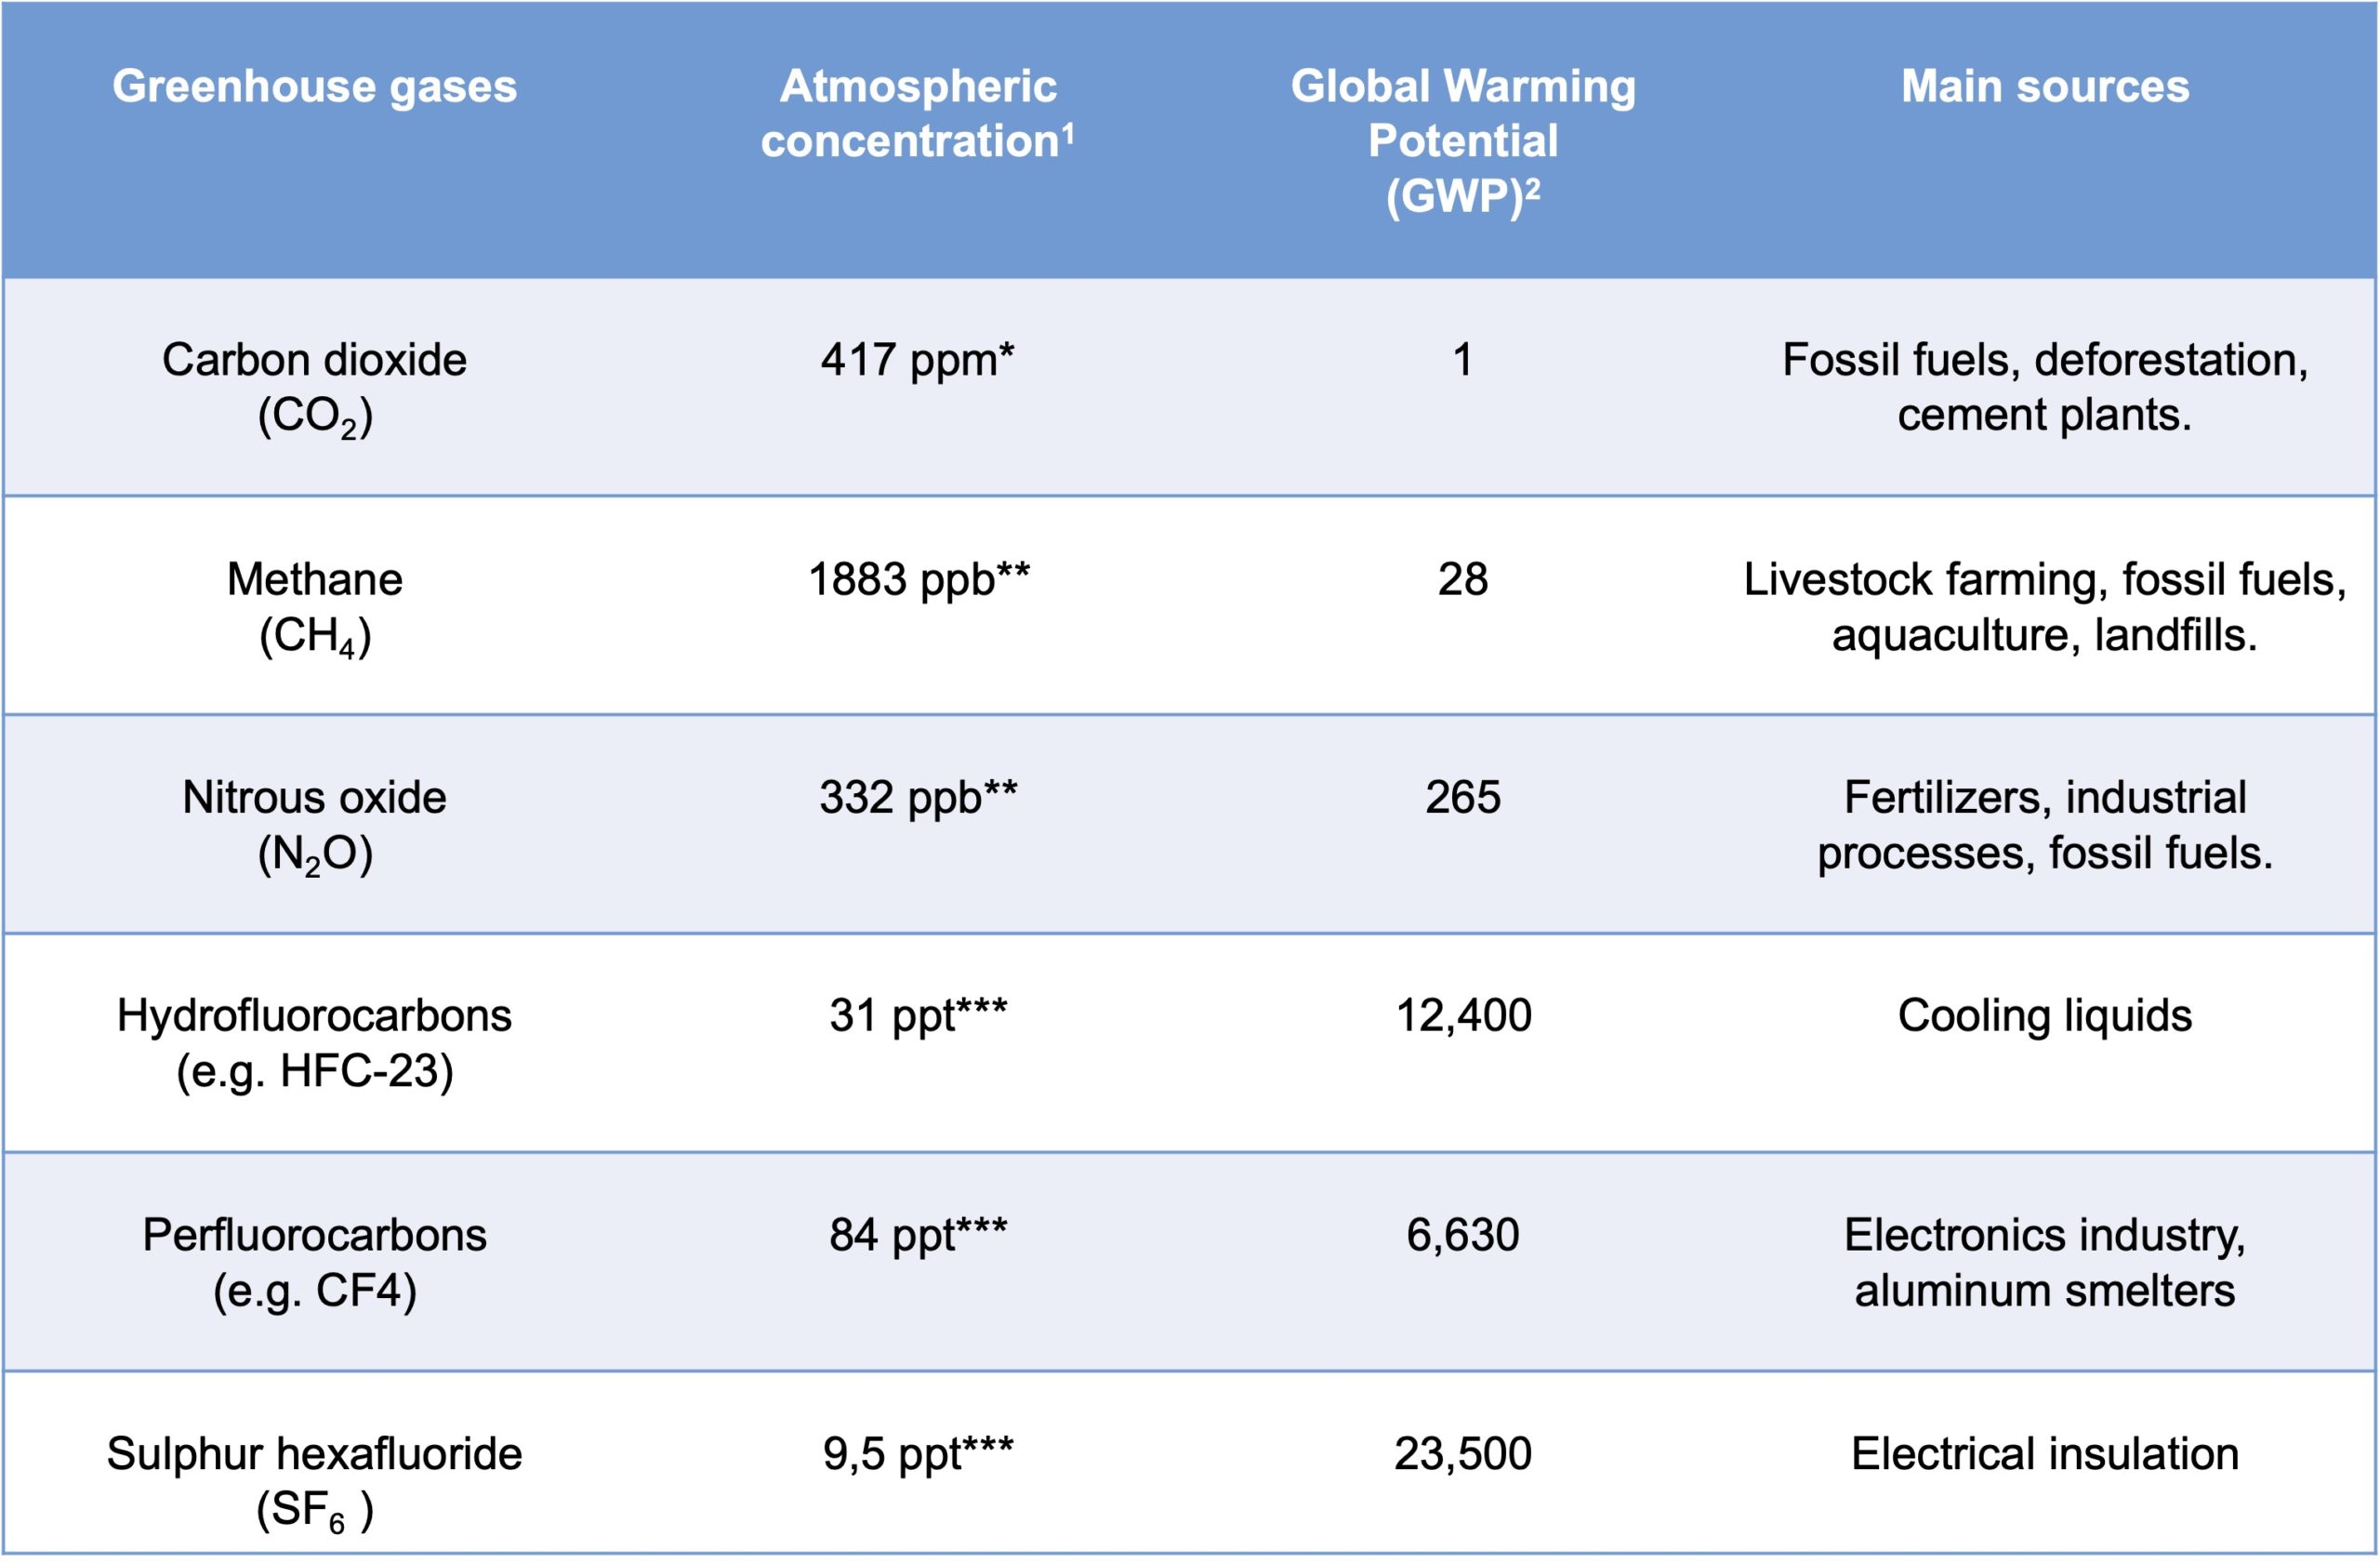
To calculate this contribution to global greenhouse gas emissions, the method generally used is to convert these emissions into CO2 equivalents (CO2eq) by multiplying their quantity in the atmosphere by their respective GWP. For example, 1 kg of SF6 is equivalent to 23,500 kg (23.5 tonnes) of CO2 (1 kg × 23,500 = 23,500 CO2eq), while it takes 1000 kg of methane to reach an equivalent amount of CO2 (1000 kg × 28 = 28,000 CO2eq). When this method is applied to all gases, it is estimated that 75% of greenhouse gas emissions are in the form of CO2, the remainder coming from methane (17%), nitrous oxide (6%), and various fluorinated gases (2%) (Figure 1).
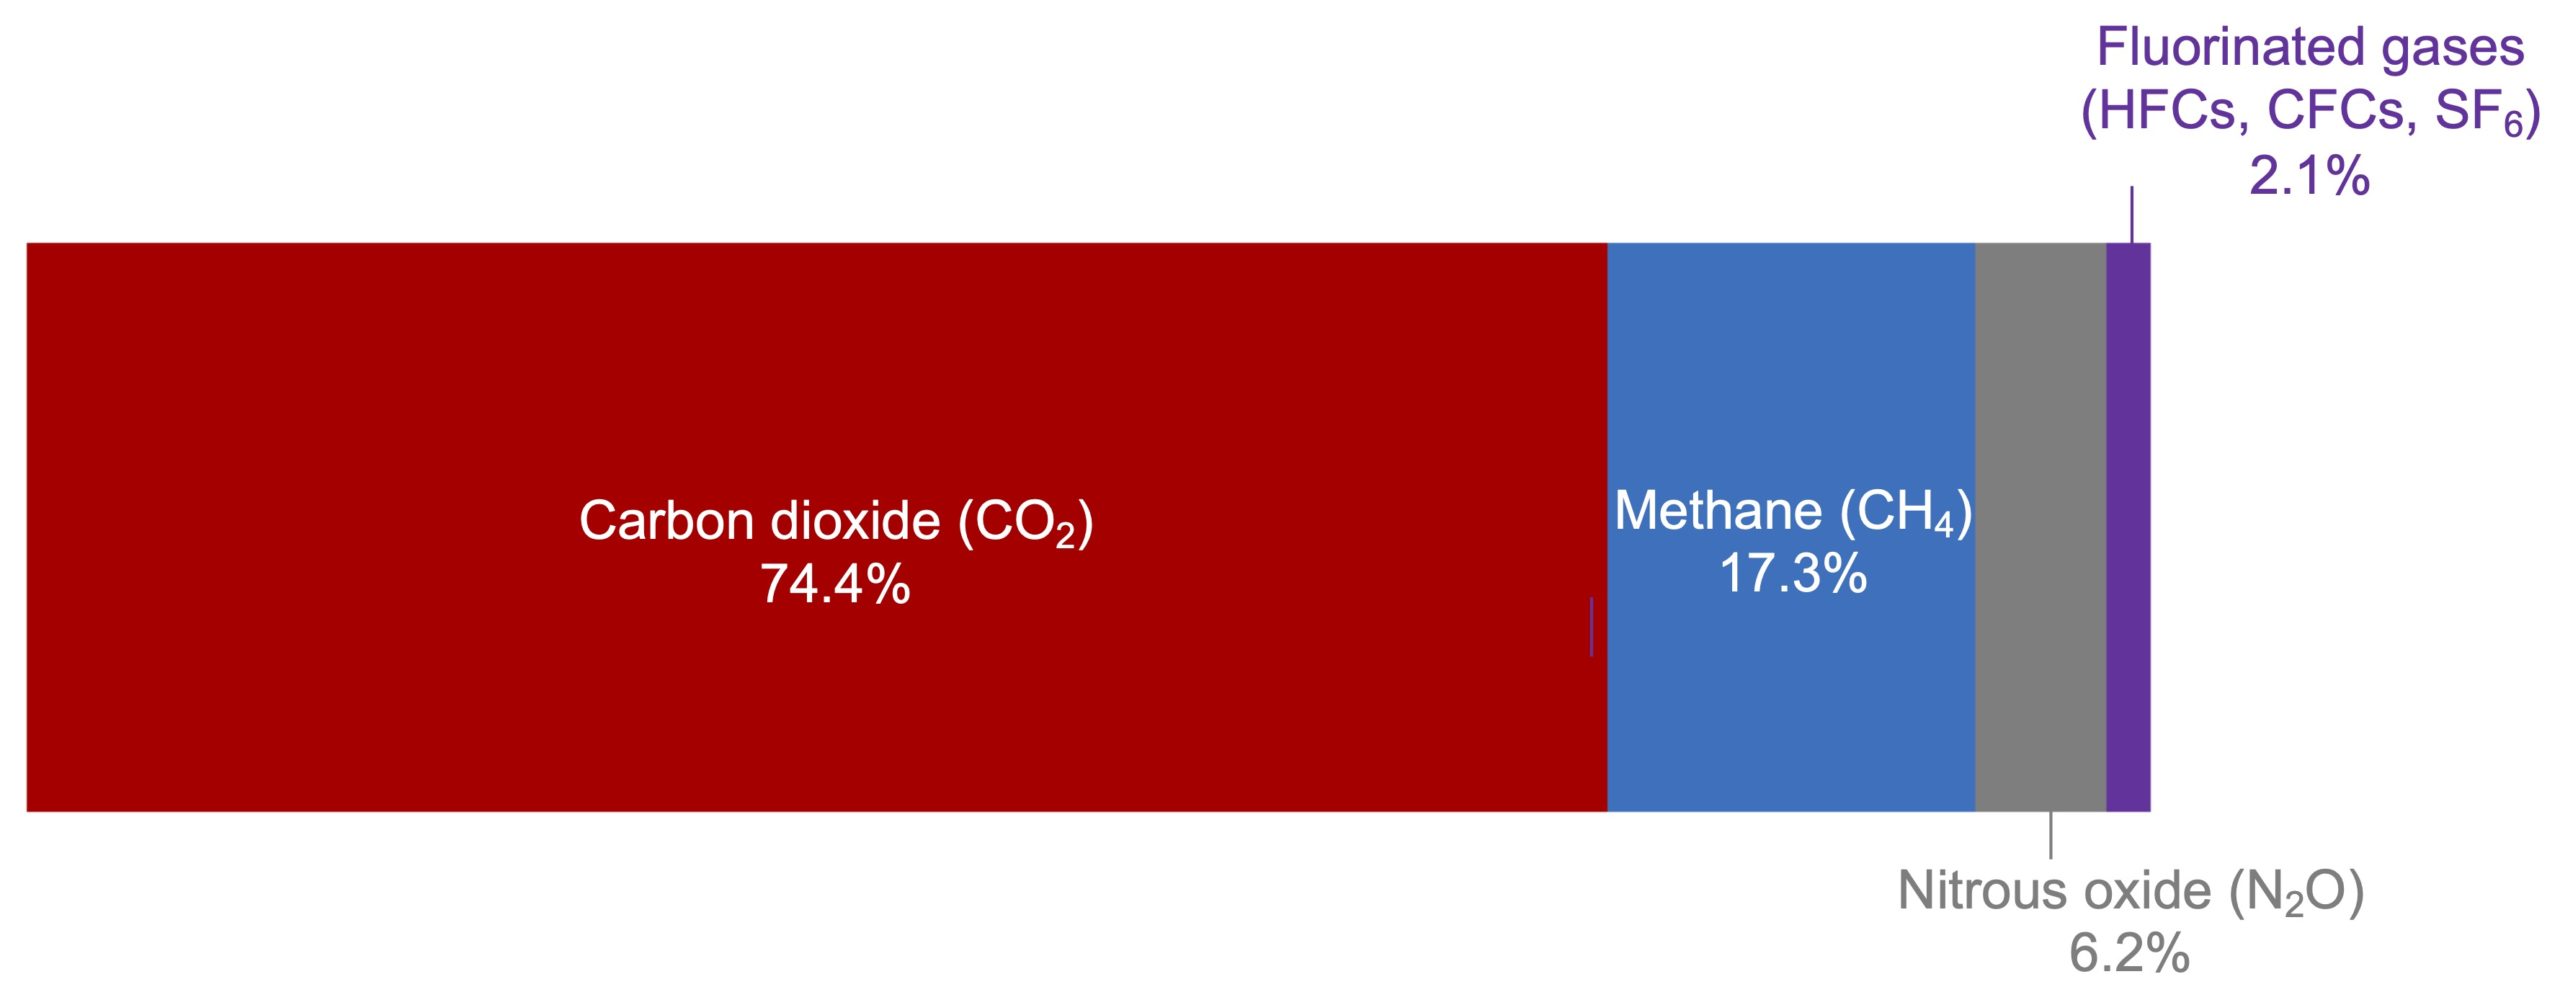
Figure 1. Distribution of greenhouse gas emissions. Adapted from Ritchie and Roser (2020).
Emissions sources
The use of fossil fuels to support human activities (transport, electricity production, heating, various industrial processes) is the main source of greenhouse gases, accounting for around three quarters of total emissions (Figure 2). This enormous “carbon footprint” implies that the fight against global warming necessarily requires a transition to “cleaner” sources of energy, in particular with regard to transport and electricity production. This is especially true in a country like Canada, where we emit an average of 20 tonnes of CO2eq per person per year, which ranks us, along with the United States and Australia, among the worst producers of GHGs in the world (Quebec, for its part, does better, with about 10 tonnes of CO2eq per person per year).
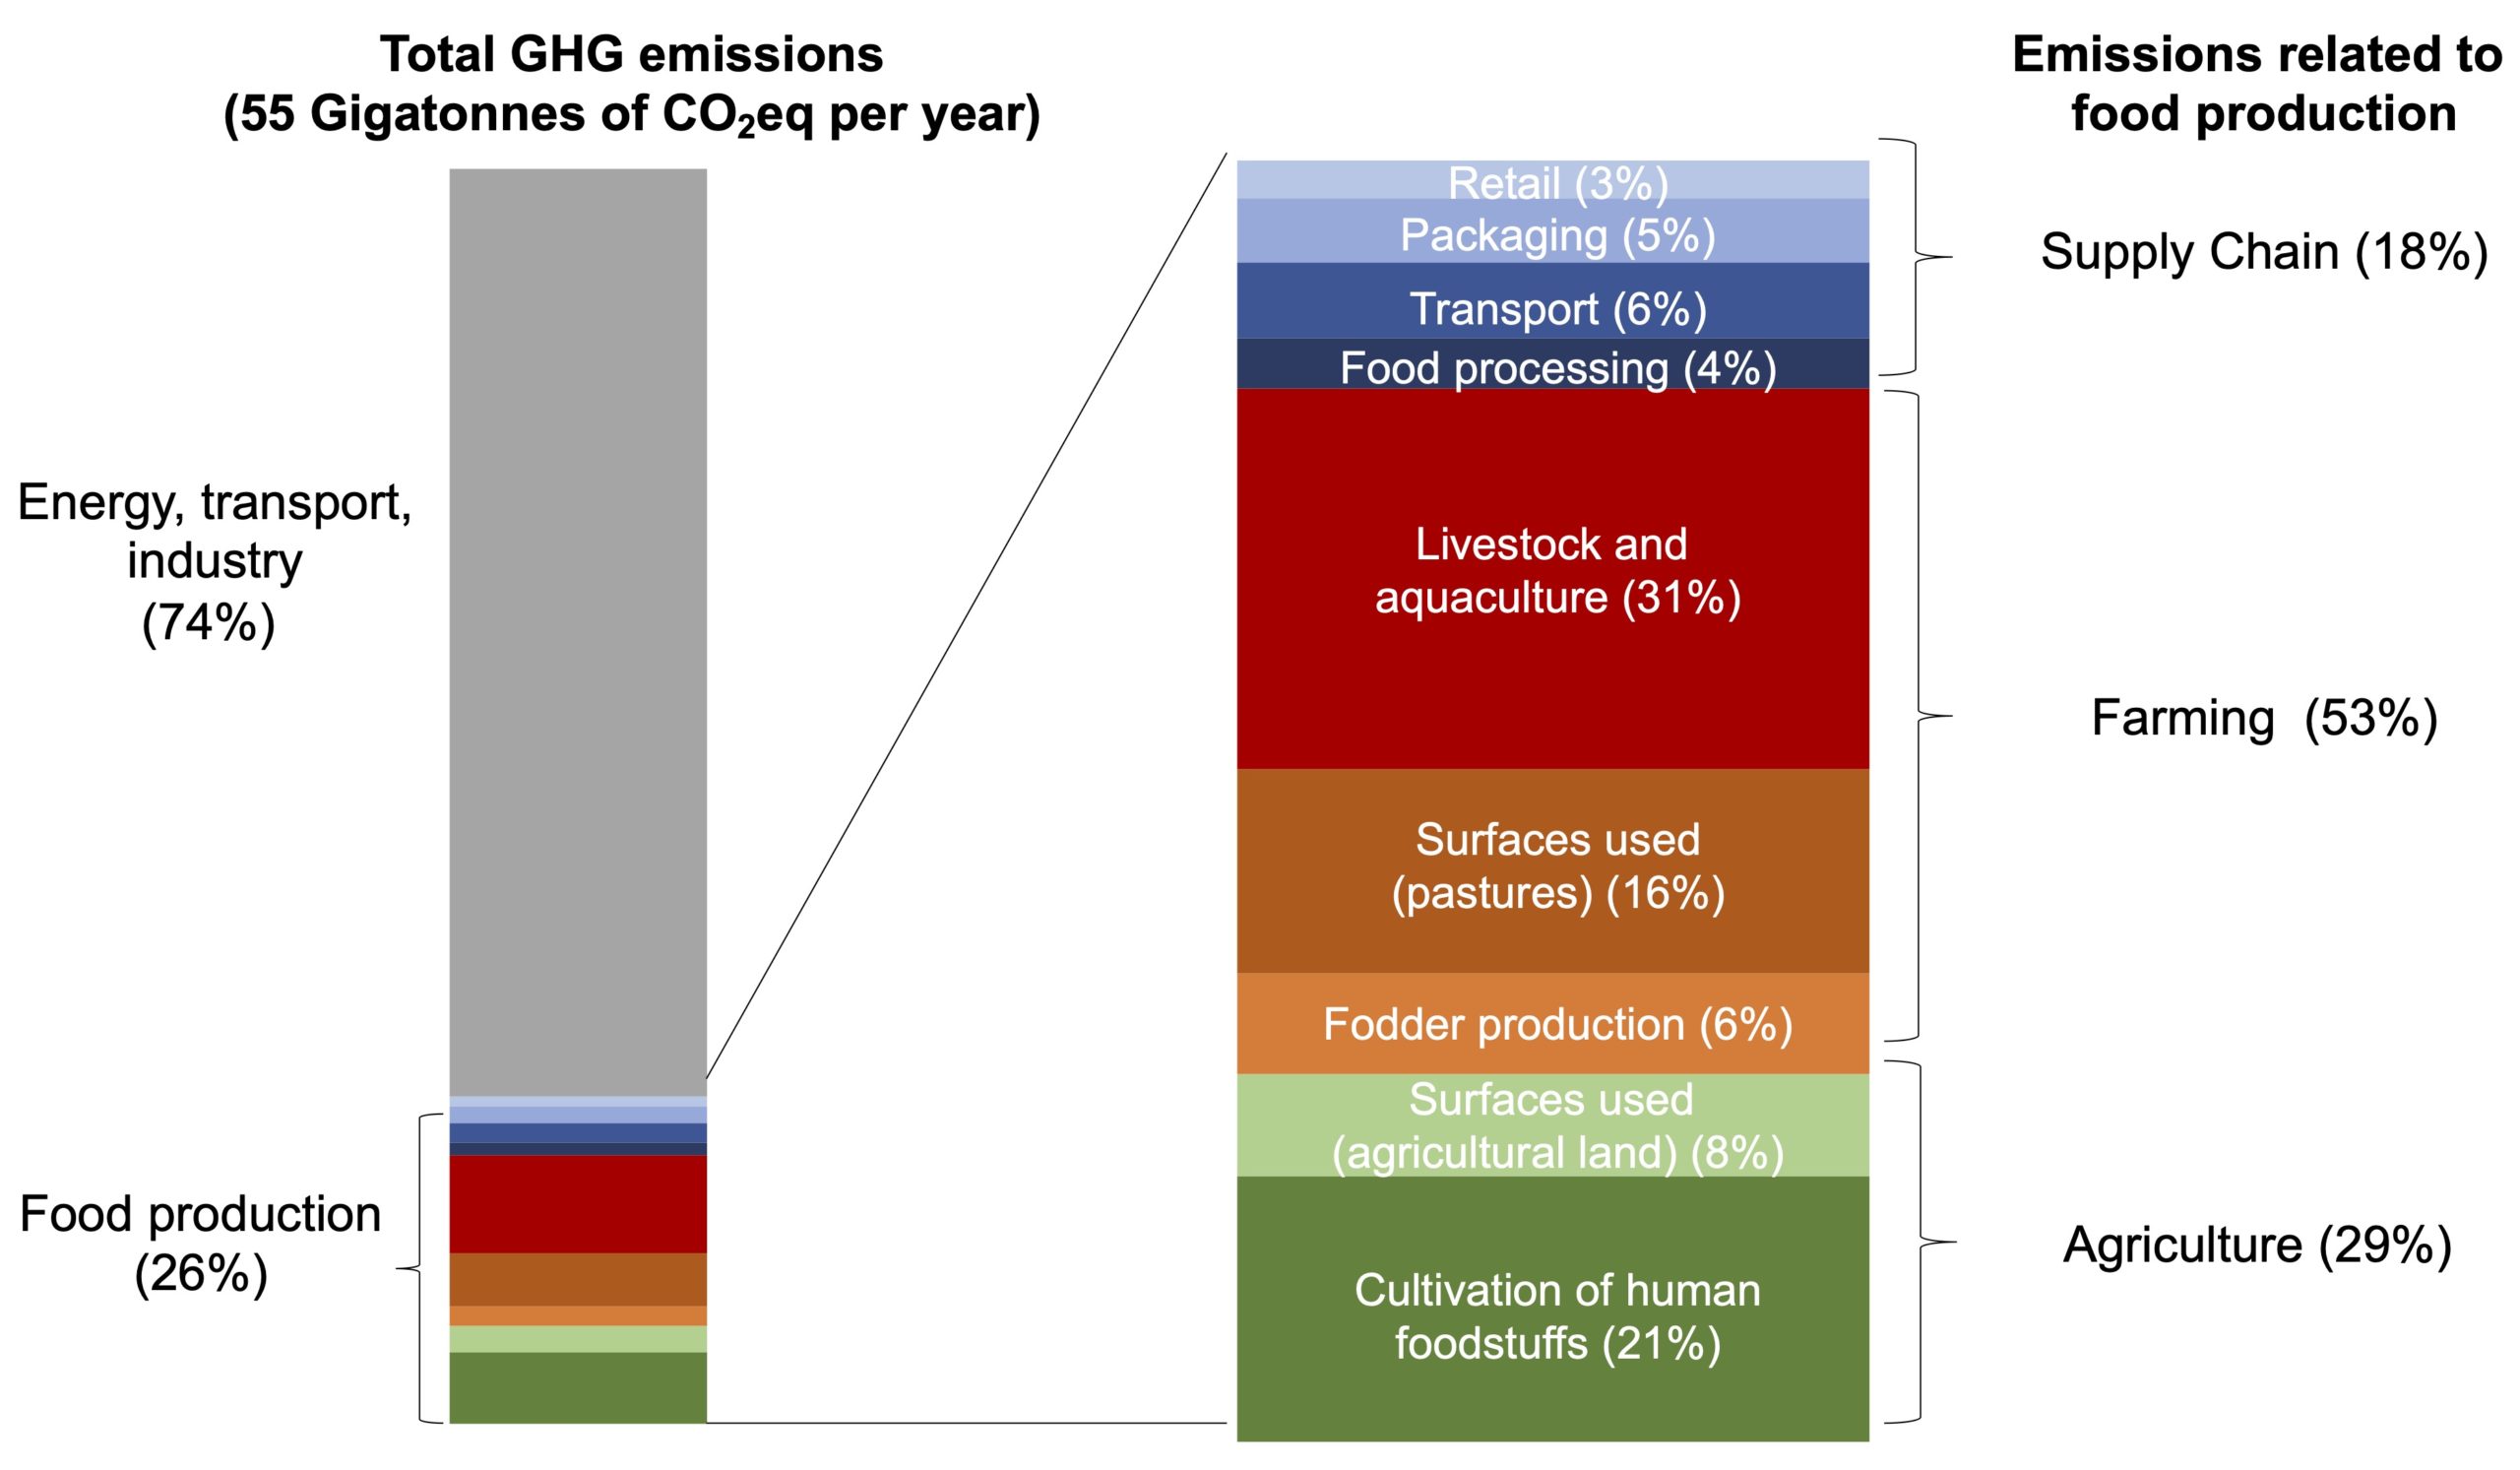
Figure 2. Contribution of the food sector to the annual production of greenhouse gases. Adapted from Ritchie and Roser (2020).
Another industry that contributes significantly to greenhouse gas emissions, but that we hear much less about, is food production. It is estimated that around 25% of all these gases come from the production and distribution of food, a proportion that rises to 33% when food waste is taken into account. The food sector involved in animal protein production alone is responsible for half of these food-related GHG emissions, mainly due to methane produced by livestock and aquaculture (31%) (see box). Livestock farming also requires large spaces, created in some cases by massive deforestation (in the Amazon, for example), which eliminates huge areas of plants that can sequester COs. Livestock farming also requires large quantities of forage plants and therefore the use of nitrogen fertilizers to accelerate the growth of these plants. The CO2 and nitrous oxide released into the atmosphere during the production of these fertilizers therefore contribute to the GHG generated by livestock.
Where does methane come from?
Methane (CH4) is the end product of the decomposition of organic matter. Methanogenesis is made possible by certain anaerobic microorganisms from the archaea domain (methanogens) which reduce carbon, present in the form of CO2 or certain simple organic acids (acetate, for example), to methane, according to the following reactions:
CO2 + 4 H2 → CH4 + 2 H2O
CH3COOH → CH4 + CO2
The methane generated by livestock comes mainly from the fermentation of carbonaceous products inside the digestive system of ruminants. In these animals, the digestion of plant matter generates volatile fatty acids (acetate, propionate, butyrate), which are absorbed by the animal and used as a source of energy, and lead in parallel to the production of methane, about 500 L per day per animal, most of it being released through the mouth of the animal. Globally, livestock is estimated to emit about 3.1 Gt of CO2-eq as methane, which represents almost half of all anthropogenic methane emissions.
Aquaculture is another rapidly expanding form of farming, now accounting for over 60% of the global supply of fish and seafood for human consumption. Although GHG emissions from this sector are still much lower than those associated with livestock, recent measurements nonetheless indicate a sharp increase in its global warming potential, mainly due to an increase in methane production. In these systems, the sediments accumulate food residues used for the growth of fish and seafood as well as the droppings generated by these animals. The transformation of this organic material leads to the production of methane, which can then be diffused into the atmosphere.
Finally, it should be noted that the majority of aquaculture systems are located in Asia, where they are often established in regions previously occupied by mangroves, ecosystems located along the coasts and deltas of tropical regions. The destruction of these mangroves (very often for shrimp farming) is very harmful to global warming, because mangrove forests collectively store around 4 billion tonnes of CO2 and their elimination therefore has a concrete impact on the climate.
A good way to visualize the impact of livestock farming on GHG production is to compare the emissions associated with different foods of animal and plant origin based on the amount of protein in these foods (Figure 3). These comparisons clearly show that products derived from livestock products, beef in particular, represent a much greater source of GHGs than plants. The production of 100 g of beef protein, for example, generates on average 100 times more GHGs than the same amount of protein from nuts or legumes. This is true even for beef produced in the traditional way, i.e., from animals that feed exclusively on grass: these animals grow more slowly and therefore emit methane for a longer period, which cancels out the benefits that could be associated with the sequestration of CO2 by the grass that they eat.
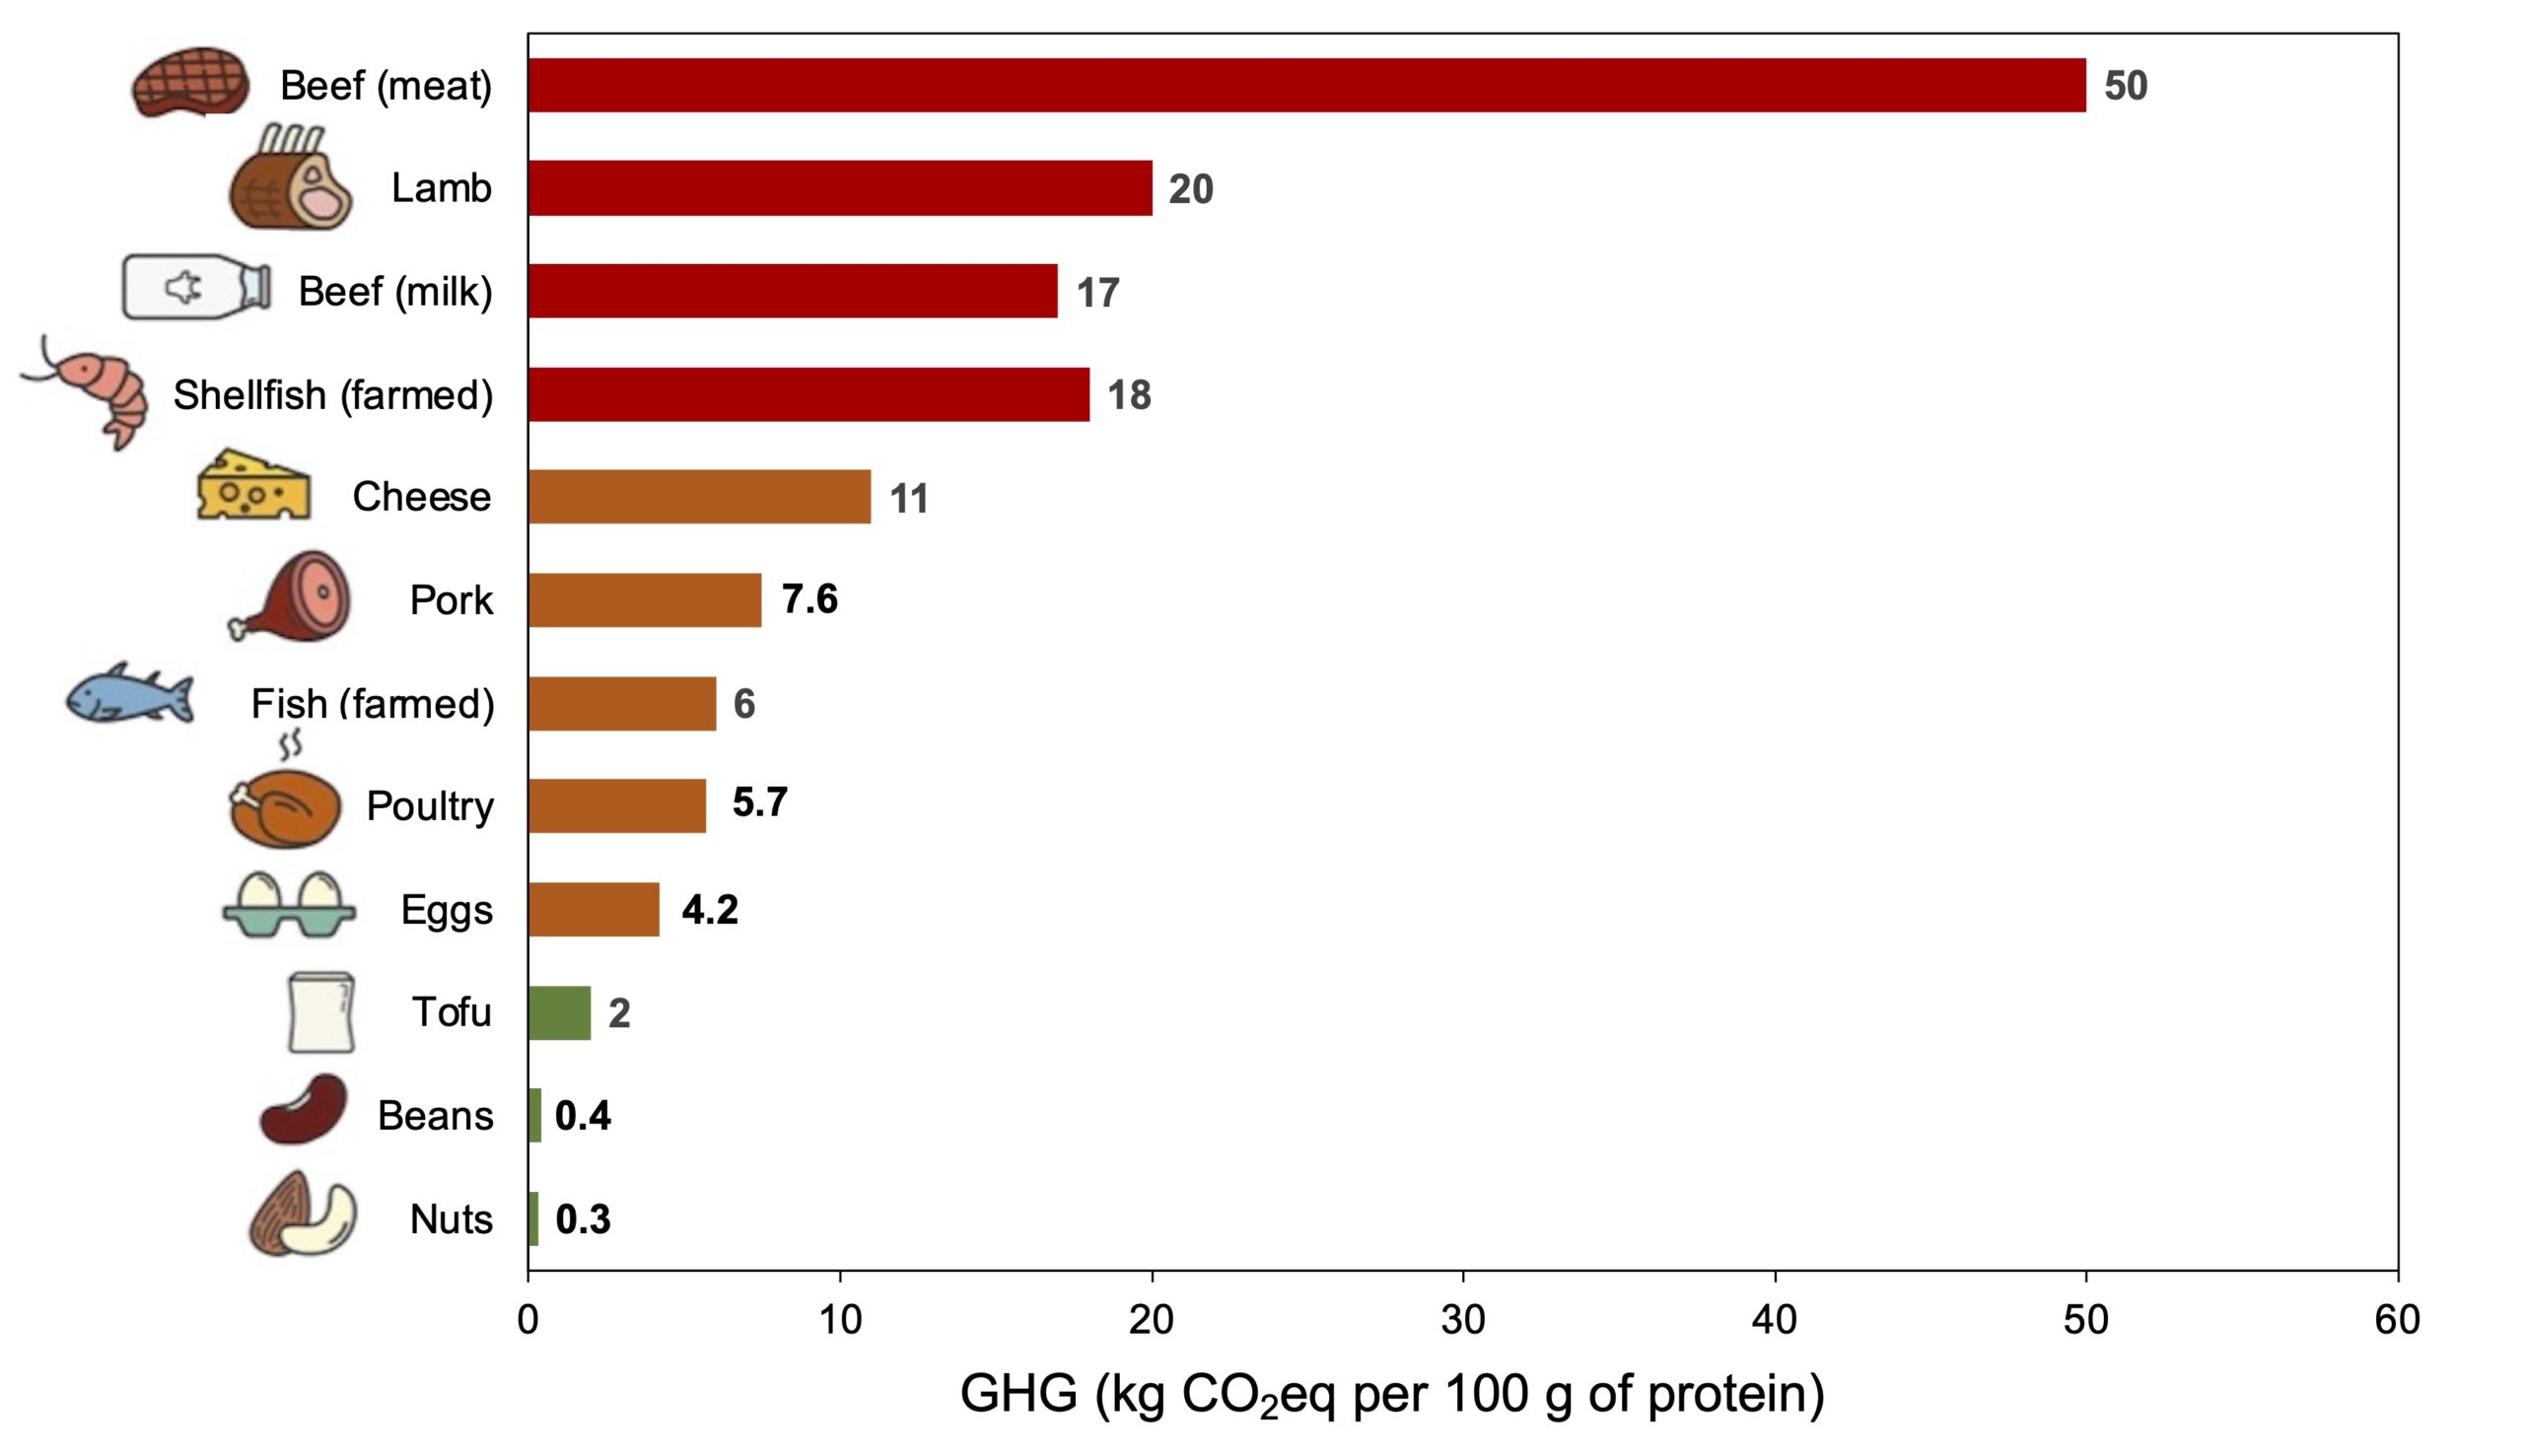
Figure 3. Comparison of GHG levels generated during the production of different protein sources. Based on Poore and Nemecek (2018), as modified by Eikenberry (2018).
These huge differences in GHGs associated with the production of everyday food therefore clearly show that our food choices can have a significant influence on global warming. Since the majority of GHG emissions come from livestock, it is evident that a reduction in the consumption of meat, and animal products as a whole, will have the most positive impact. These benefits can be observed even with a fairly modest reduction in meat intake, as in the Mediterranean diet, or simply by replacing products from ruminants (beef and dairy products) by other sources of animal protein (poultry, pork, fish) (Figure 4). Obviously, a more drastic reduction in meat intake is even more beneficial, whether through the adoption of a flexitarian diet (high intake of plants, but little meat and animal products), vegetarian (no animal products, with the exception of eggs, dairy products and sometimes fish), and vegan (no animal products). This remains true even if the plants consumed come from abroad and sometimes travel long distances, because contrary to popular belief, transport only accounts for a small proportion (less than 10%) of the GHGs associated with a given food.
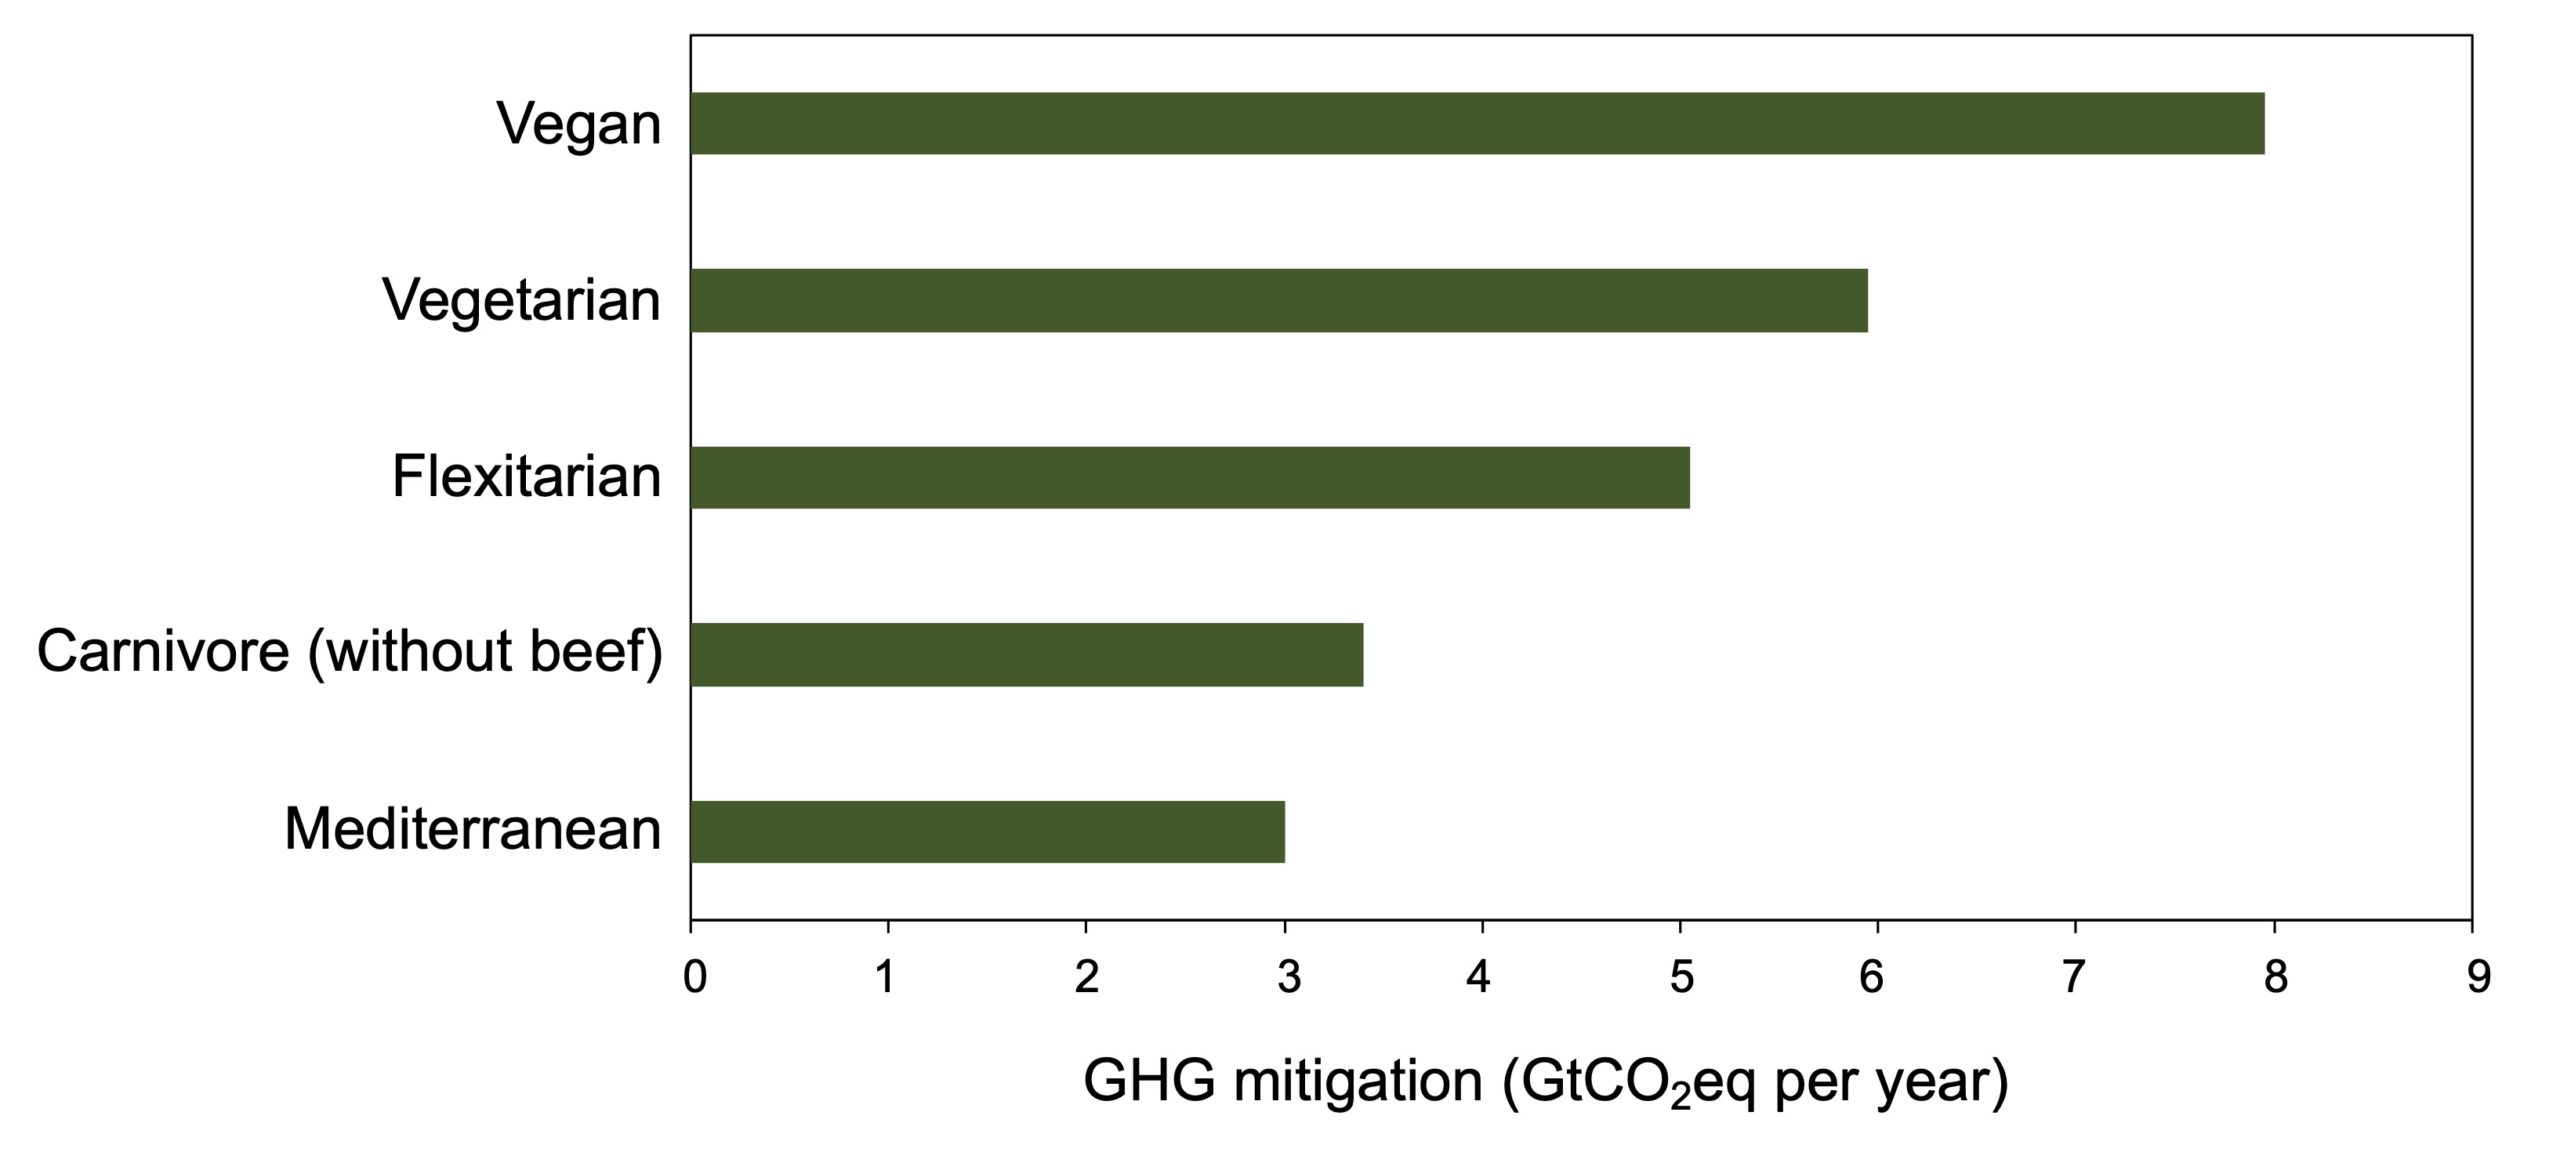
Figure 4. Potential for mitigation of GHG emissions by different types of diets. Adapted from IPCC (2019).
It is impossible to completely decarbonize food production, especially in a world where there are over 9 billion people to feed daily. On the other hand, there is no doubt that the GHG footprint of food can be significantly reduced by reducing the consumption of products derived from ruminants, such as beef and dairy products. This is extremely important, because the status quo is untenable. According to recent models, even if GHG emissions from fossil fuels ceased immediately, we would still not succeed in reaching the target of a maximum warming of 1.5ºC due to emissions produced by the current food production system.
Another aspect that is often overlooked is how fast and significant this positive impact of a reduction in cattle breeding products can be. Even though methane is a GHG almost 30 times more powerful than CO2, its life in the atmosphere is much shorter, around 10–20 years vs. several thousand years for CO2. Concretely, this means that an immediate drop in methane emissions, for example following a drastic reduction in the consumption of beef and dairy products, can have measurable effects on GHG levels in the following years and therefore represents the fastest and most efficient way to slow global warming.
Pollution from food
In addition to contributing to global GHG emissions, another environmental impact of food production is its contribution to air pollution. This negative impact of the food sector should not be overlooked, because while the influence of global warming caused by GHGs will be felt above all in the medium and longer term, atmospheric pollutants have an immediate effect on health: air pollution is currently the 7th leading cause of premature death worldwide, being directly responsible for around 4 million deaths annually (Figure 5). In some countries, such as the United States, it is estimated that agriculture and livestock are responsible for about 20% of this air pollution-related mortality.
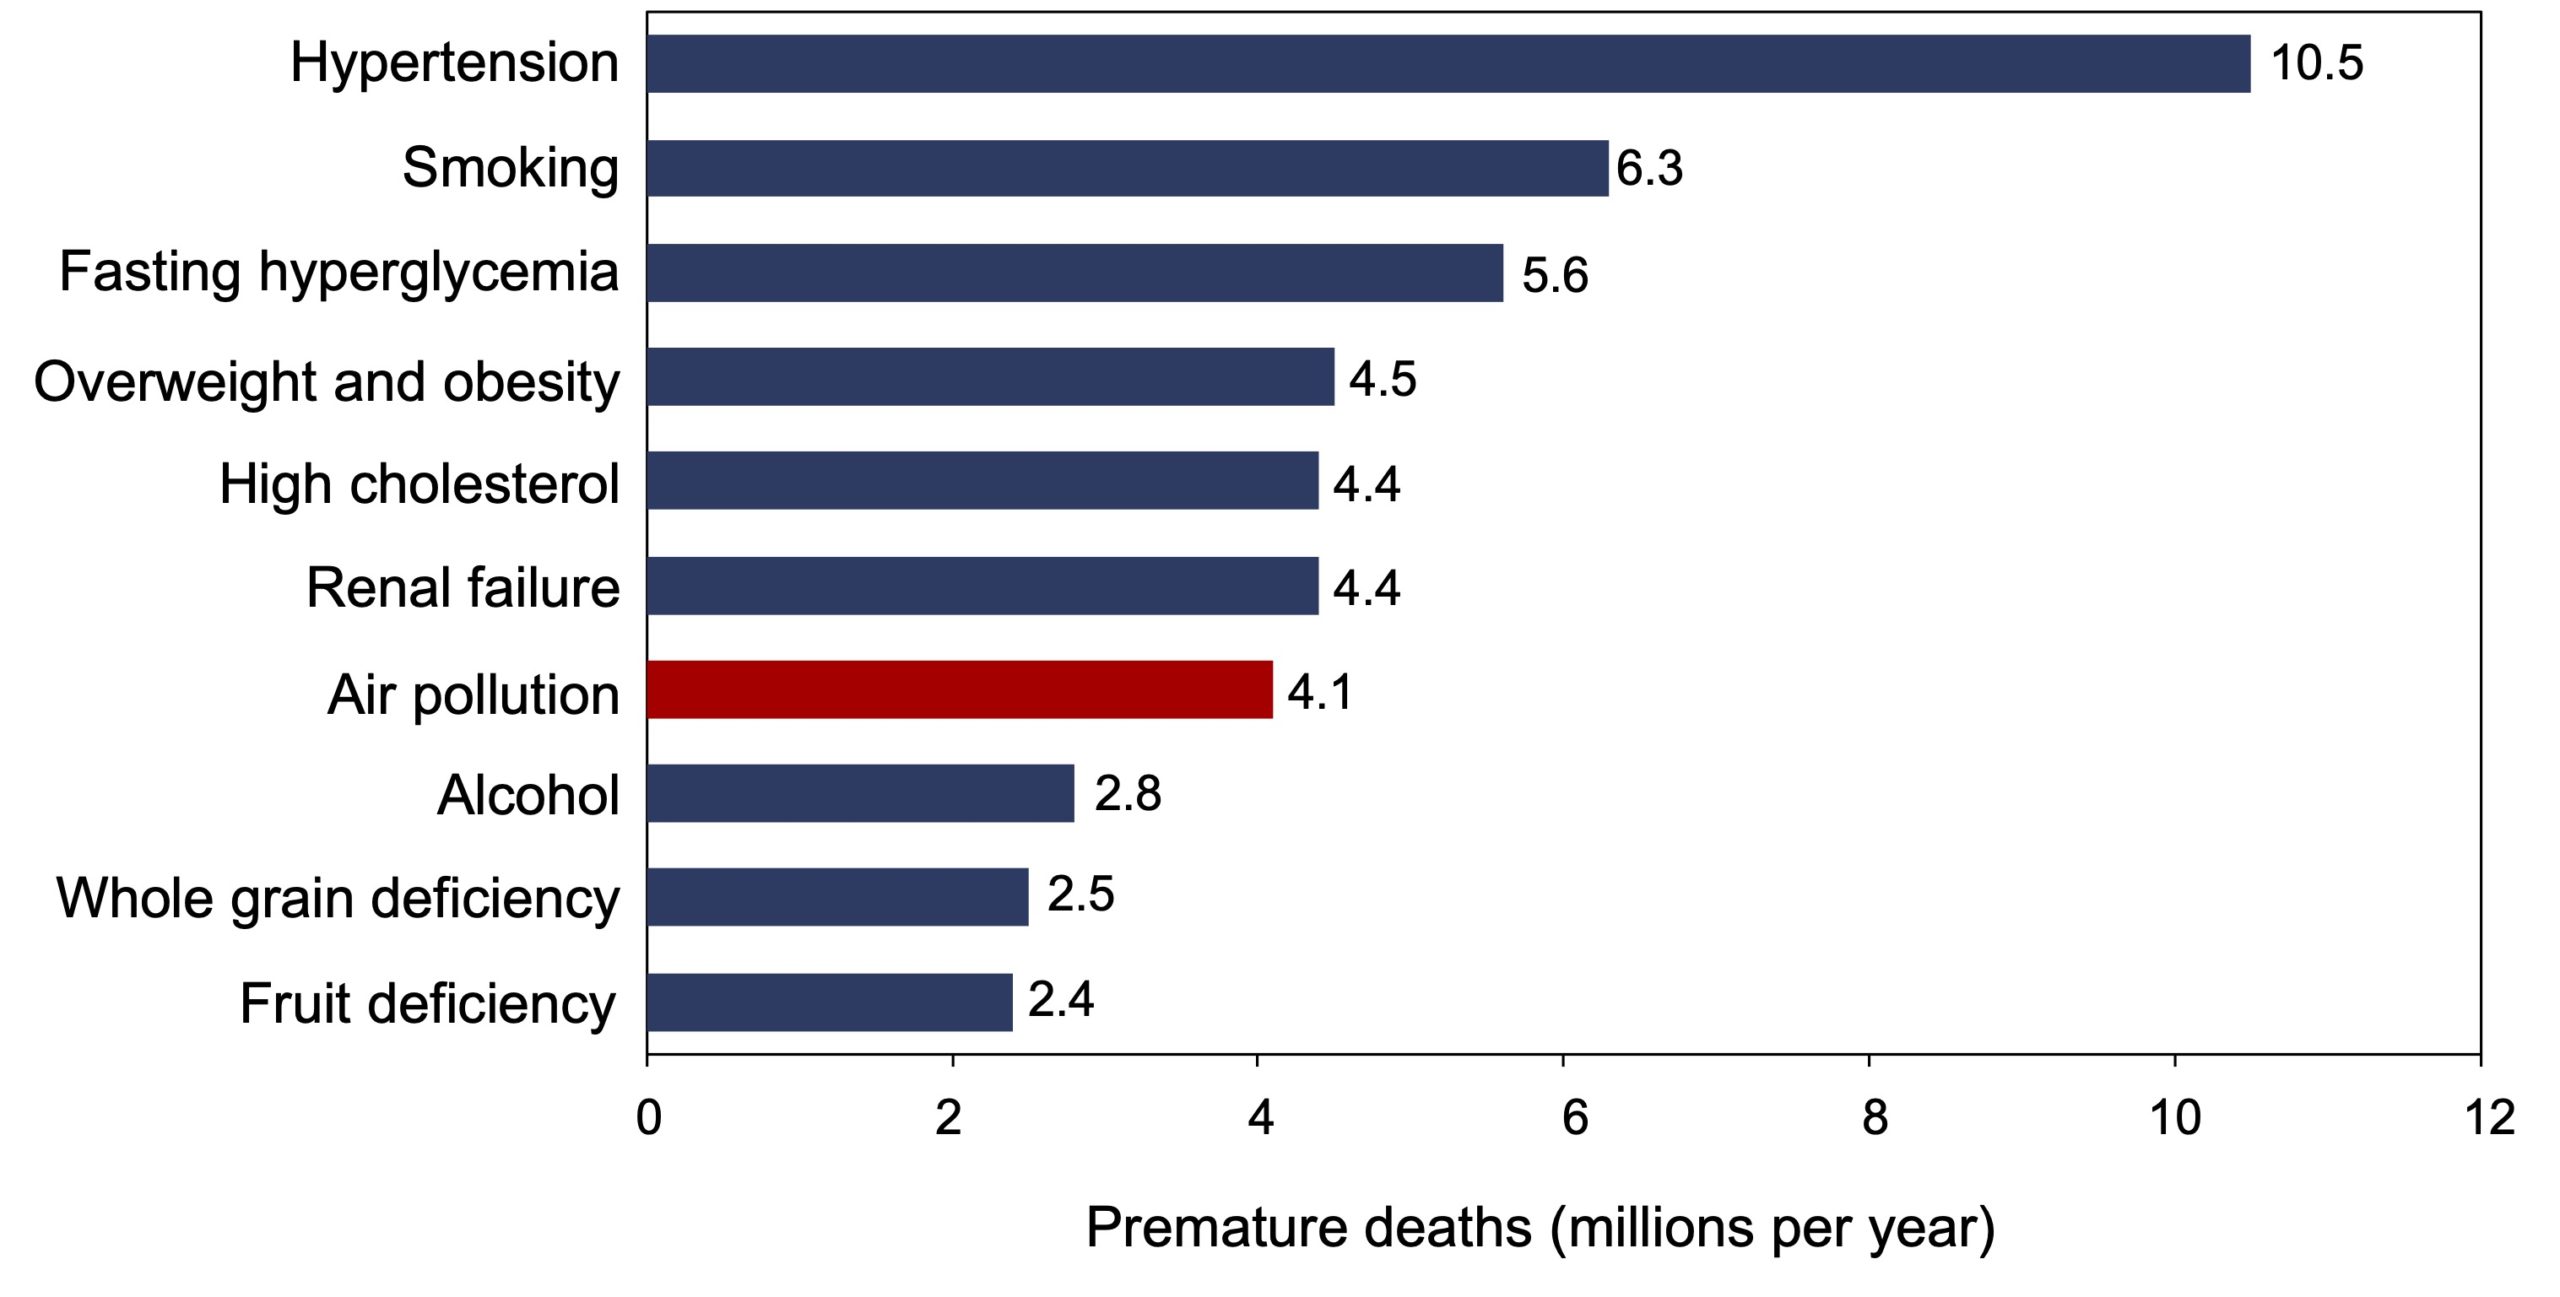
Figure 5. Leading causes of premature mortality worldwide. Note that air pollution is the only risk factor of environmental origin, not related to lifestyle. From GBD 2016 Risk Factors Collaborators (2016).
Fine particles of 2.5 µm and less (PM2.5) are mainly responsible for these negative impacts of air pollution on health. Due to their small size, these particles easily penetrate the lungs to the pulmonary alveoli, where they pass directly to the pulmonary blood vessels and then to all arteries in the body. They then produce an inflammatory reaction and oxidative stress that damage the vascular endothelium, the thin layer of cells that covers the inner walls of the arteries and ensures their proper functioning. The arteries therefore dilate less easily and tend to contract more, which interferes with normal blood circulation. For all these reasons, it is cardiovascular diseases (coronary heart disease and stroke) that represent the main consequence of exposure to fine particles, and alone are responsible for about 80% of all deaths caused by ambient air pollution (Figure 6).
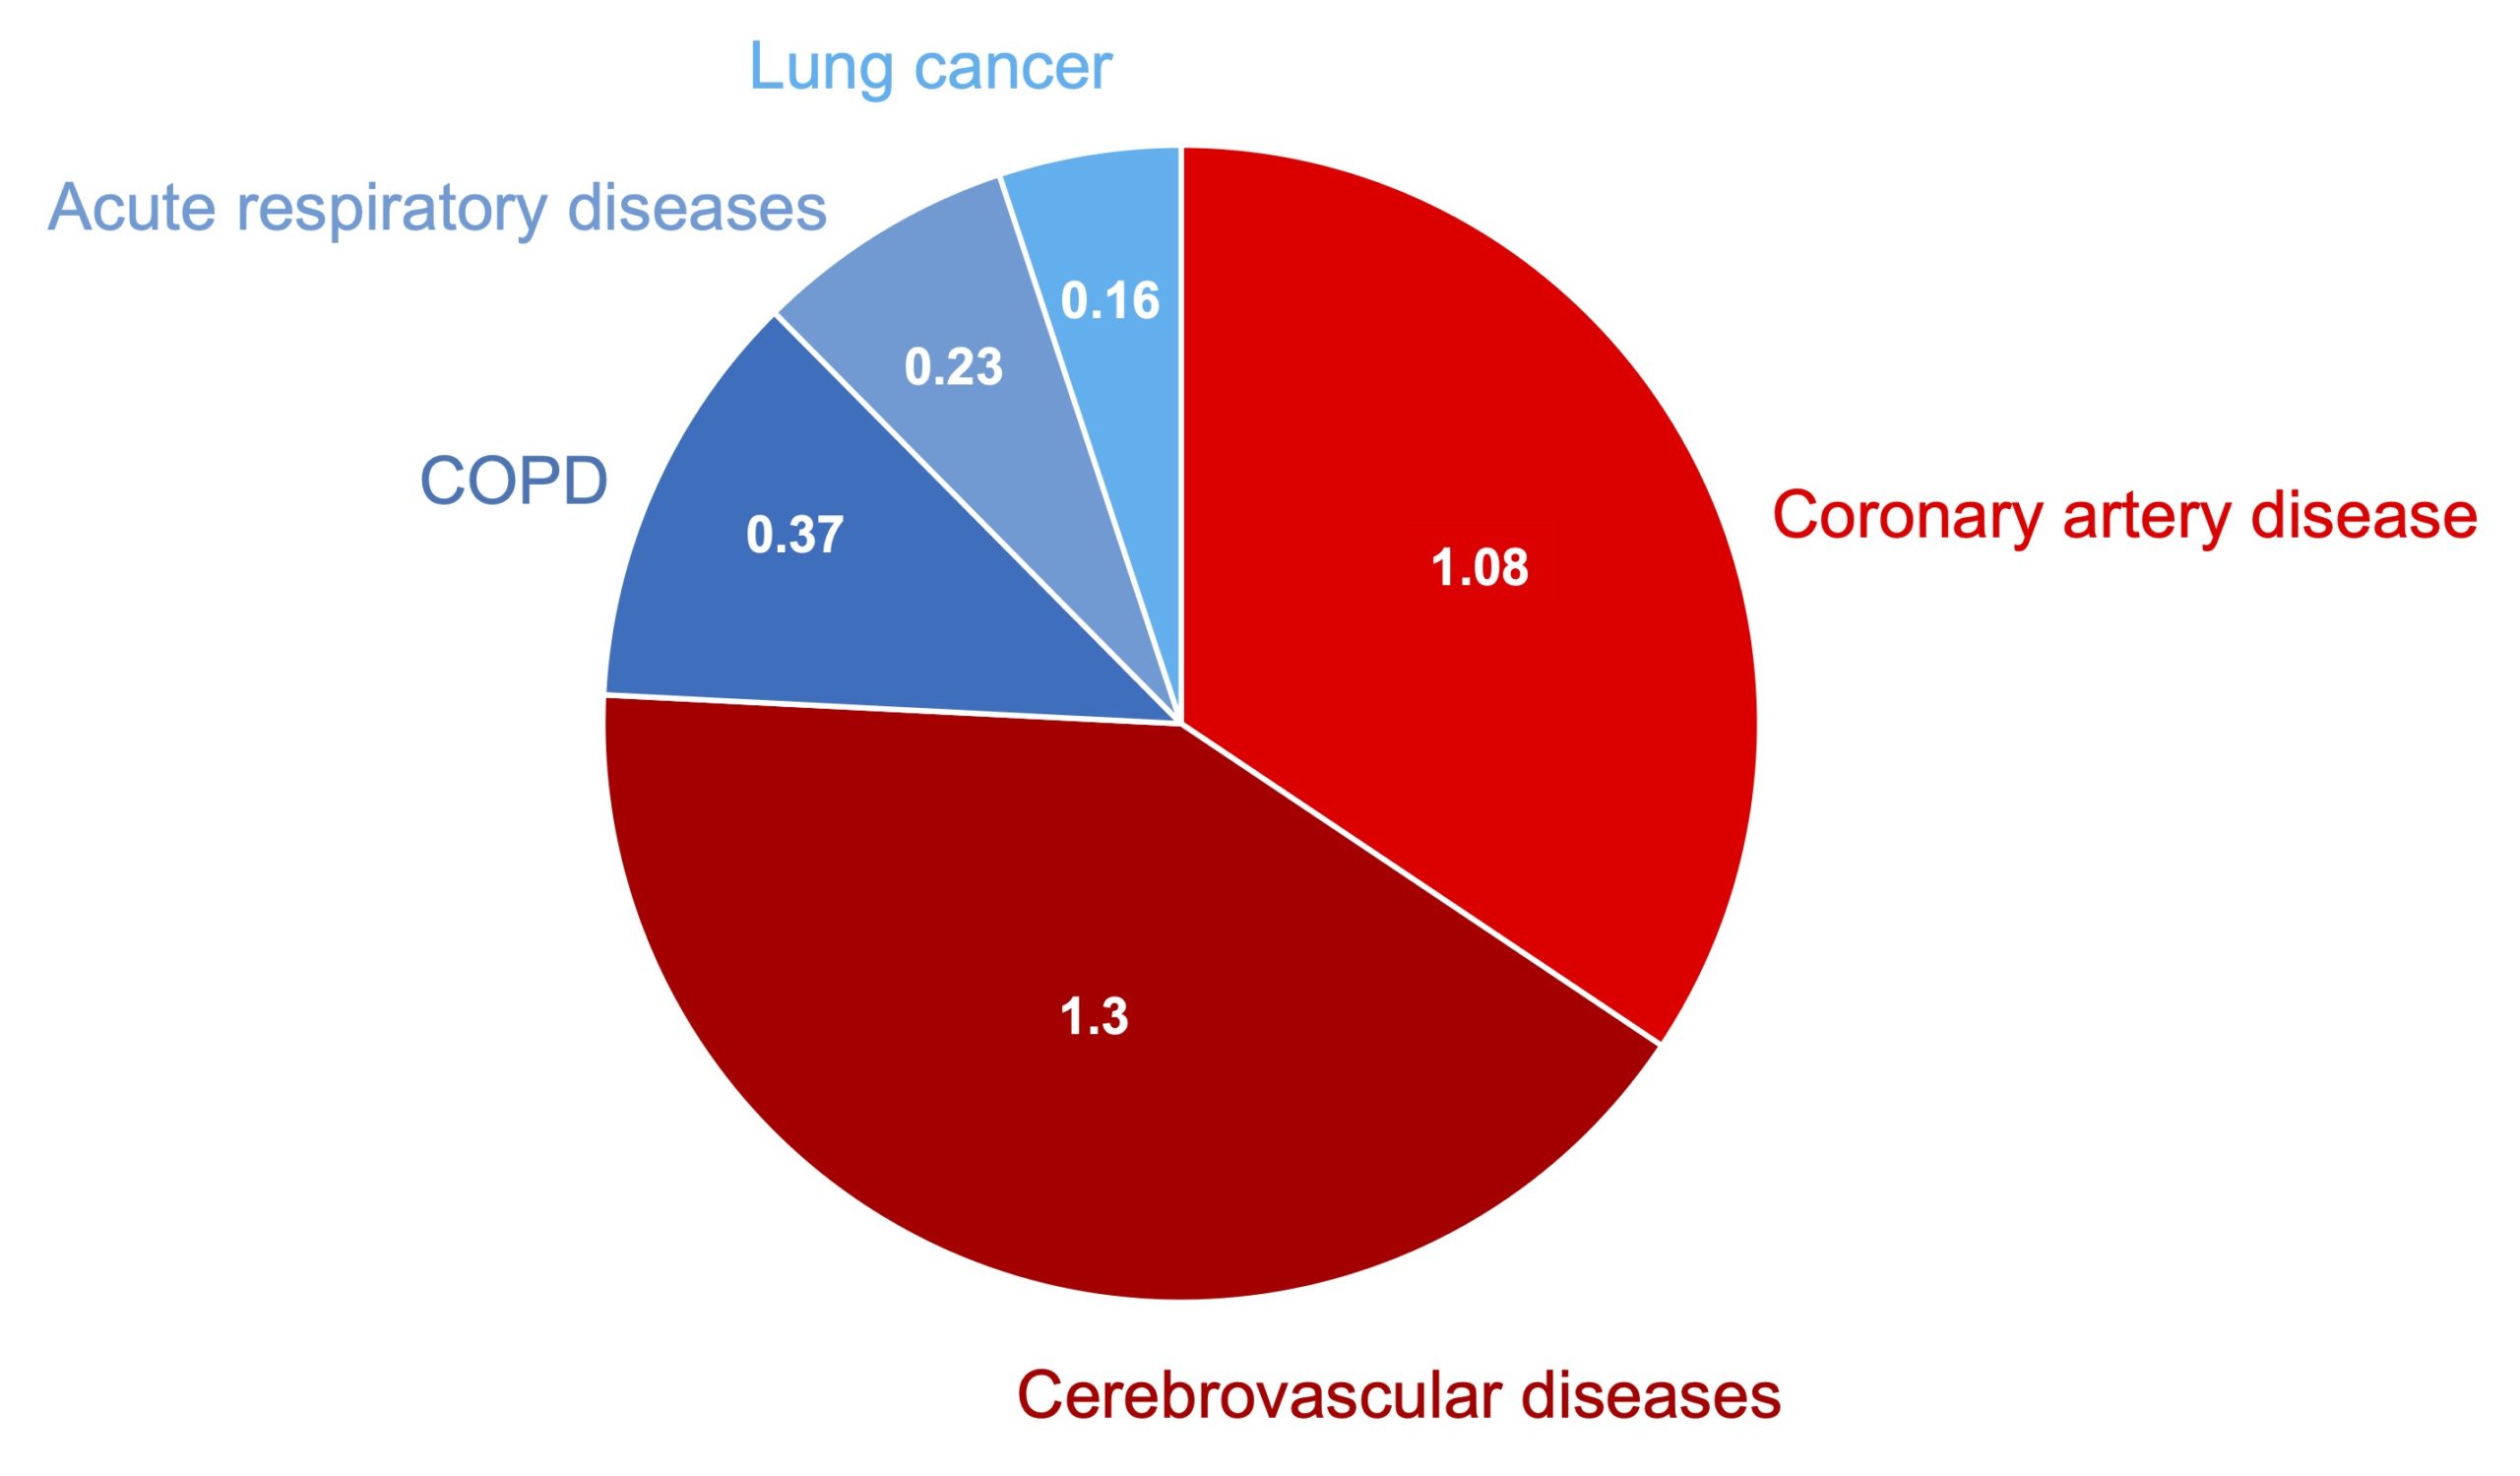
Figure 6. Distribution of premature deaths (in millions) caused by fine particles PM2.5.
Note the predominance of cardiovascular disease as a cause of death linked to air pollution. Adapted from Lelieveld et al. (2015).
Primary and secondary particles
Fine particles can be emitted directly from polluting sources (primary PM2.5) or indirectly, following the combination of several distinct particles present in the atmosphere (secondary PM2.5) (Figure 7). Much of the primary PM2.5 is in the form of carbon soot, produced by the incomplete combustion of fossil fuels (diesel and coal, especially) or biomass (forest fires, for example). Carbon soot is also associated with various organic compounds (polycyclic aromatic hydrocarbons), acids, metals, etc., which contribute to its toxicity after inhalation. These particles can be transported aloft over very long distances and, once deposited, be resuspended in the wind. In urban areas, this resuspension also takes place under the action of road traffic. This turbulence associated with automobile traffic is also responsible for the production of another class of primary PM2.5 called fugitive road dust.
Secondary PM2.5, on the other hand, are formed from precursors such as sulfur dioxide (SO2), nitrogen oxides (NOx), various volatile organic compounds containing carbon (organic carbon) as well as ammonia (NH3). The chemical reactions that govern the interaction between these different volatile substances to form the secondary fine particles are extraordinarily complex, but let us only mention that it is well established that the presence of the ammonium ion (NH4+), derived from ammonia (NH3), neutralizes the negative charge of certain gases and thus promotes their aggregation in the form of fine particles (Figure 7). Consequently, the presence of NH3 in the atmosphere often represents a limiting step in the formation of these secondary fine particles and a reduction in these emissions can therefore have concrete effects on improving air quality.
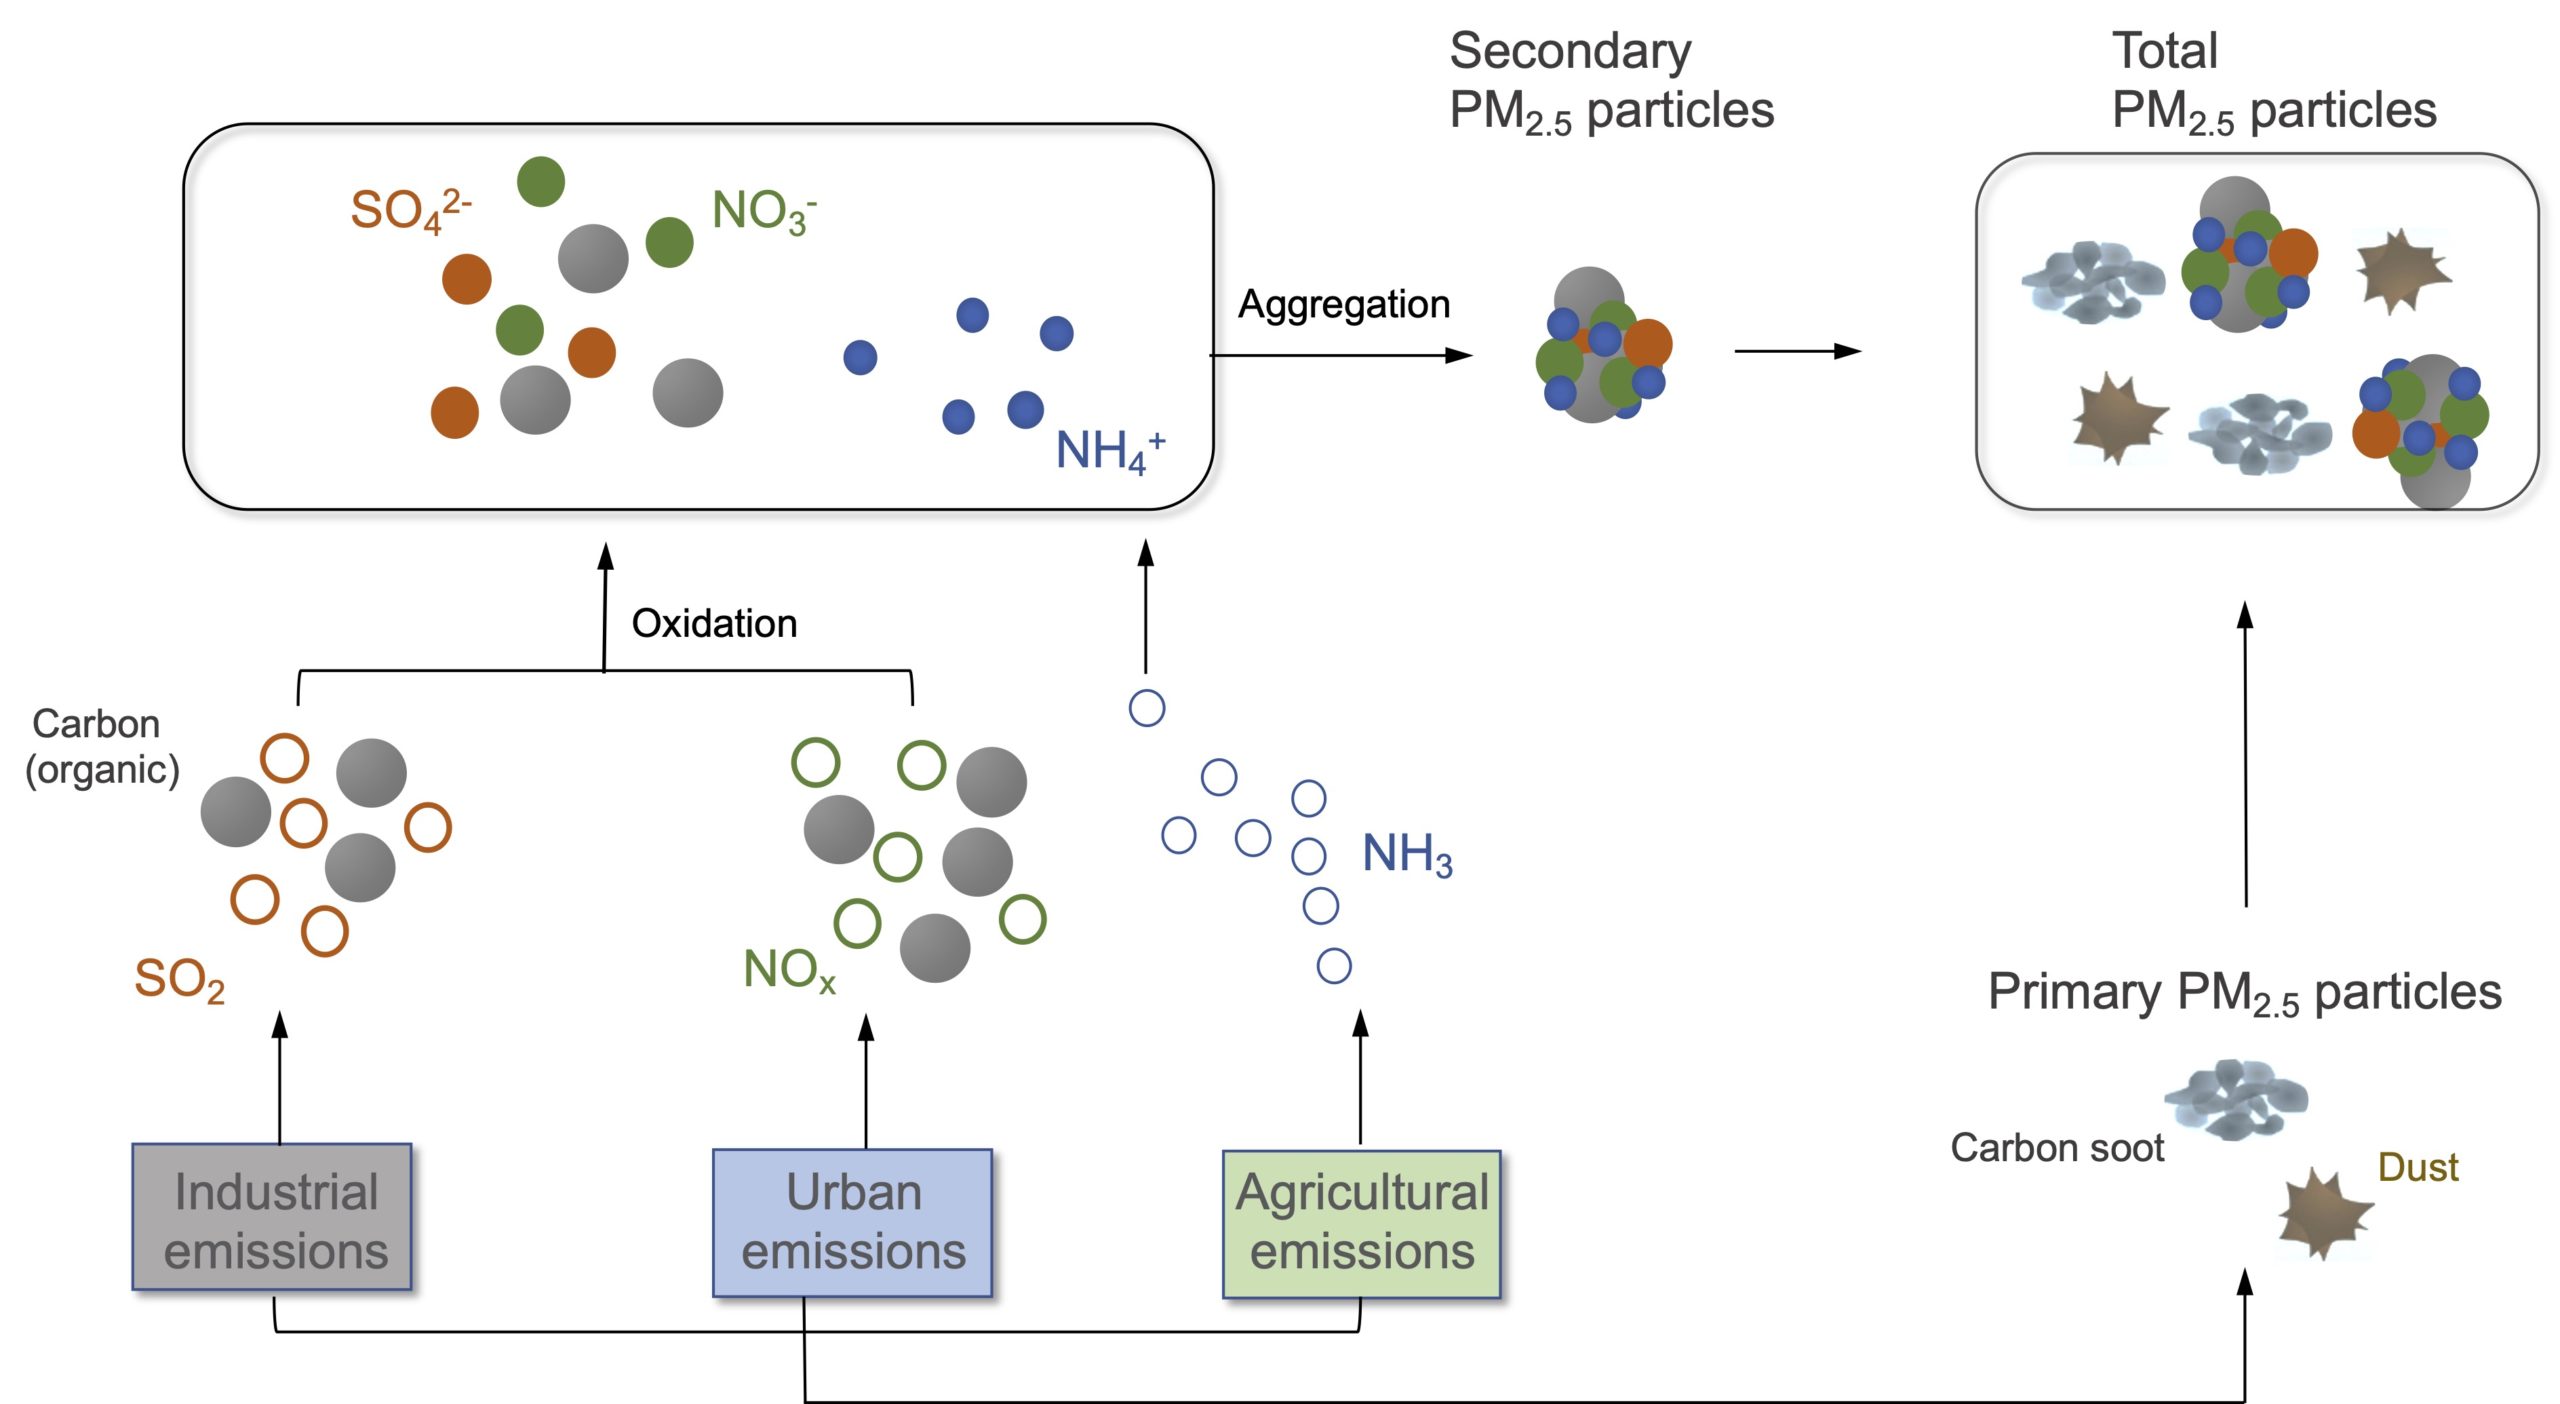
Figure 7. Schematic representation of the mechanisms of formation of fine particles PM2.5.
It is this important role of ammonia in the formation of secondary fine particles that explains the contribution of the food production sector to air pollution. Agriculture and livestock are in fact responsible for almost all anthropogenic ammonia emissions, a consequence of intensive livestock farming, the spreading of manure and slurry, and the industrial production of nitrogen fertilizers.
An American study clearly illustrates this contribution of agricultural ammonia to the negative impacts of air pollution on health. In this study, the researchers show that of the approximately 18,000 deaths caused annually by pollution derived from the agricultural sector, the vast majority (70%) of these deaths are a consequence of ammonia emissions (and therefore secondary PM2.5), while the emission of primary PM2.5, from plowing, the combustion of agricultural residues, and machinery, is responsible for the rest. Since the vast majority of ammonia emissions come from animal faeces and the use of natural (manure and slurry) or synthetic fertilizers to grow food for these animals, it is not surprising that the production of food from livestock is the main cause of deaths attributable to pollution from agricultural sources (Figure 8).
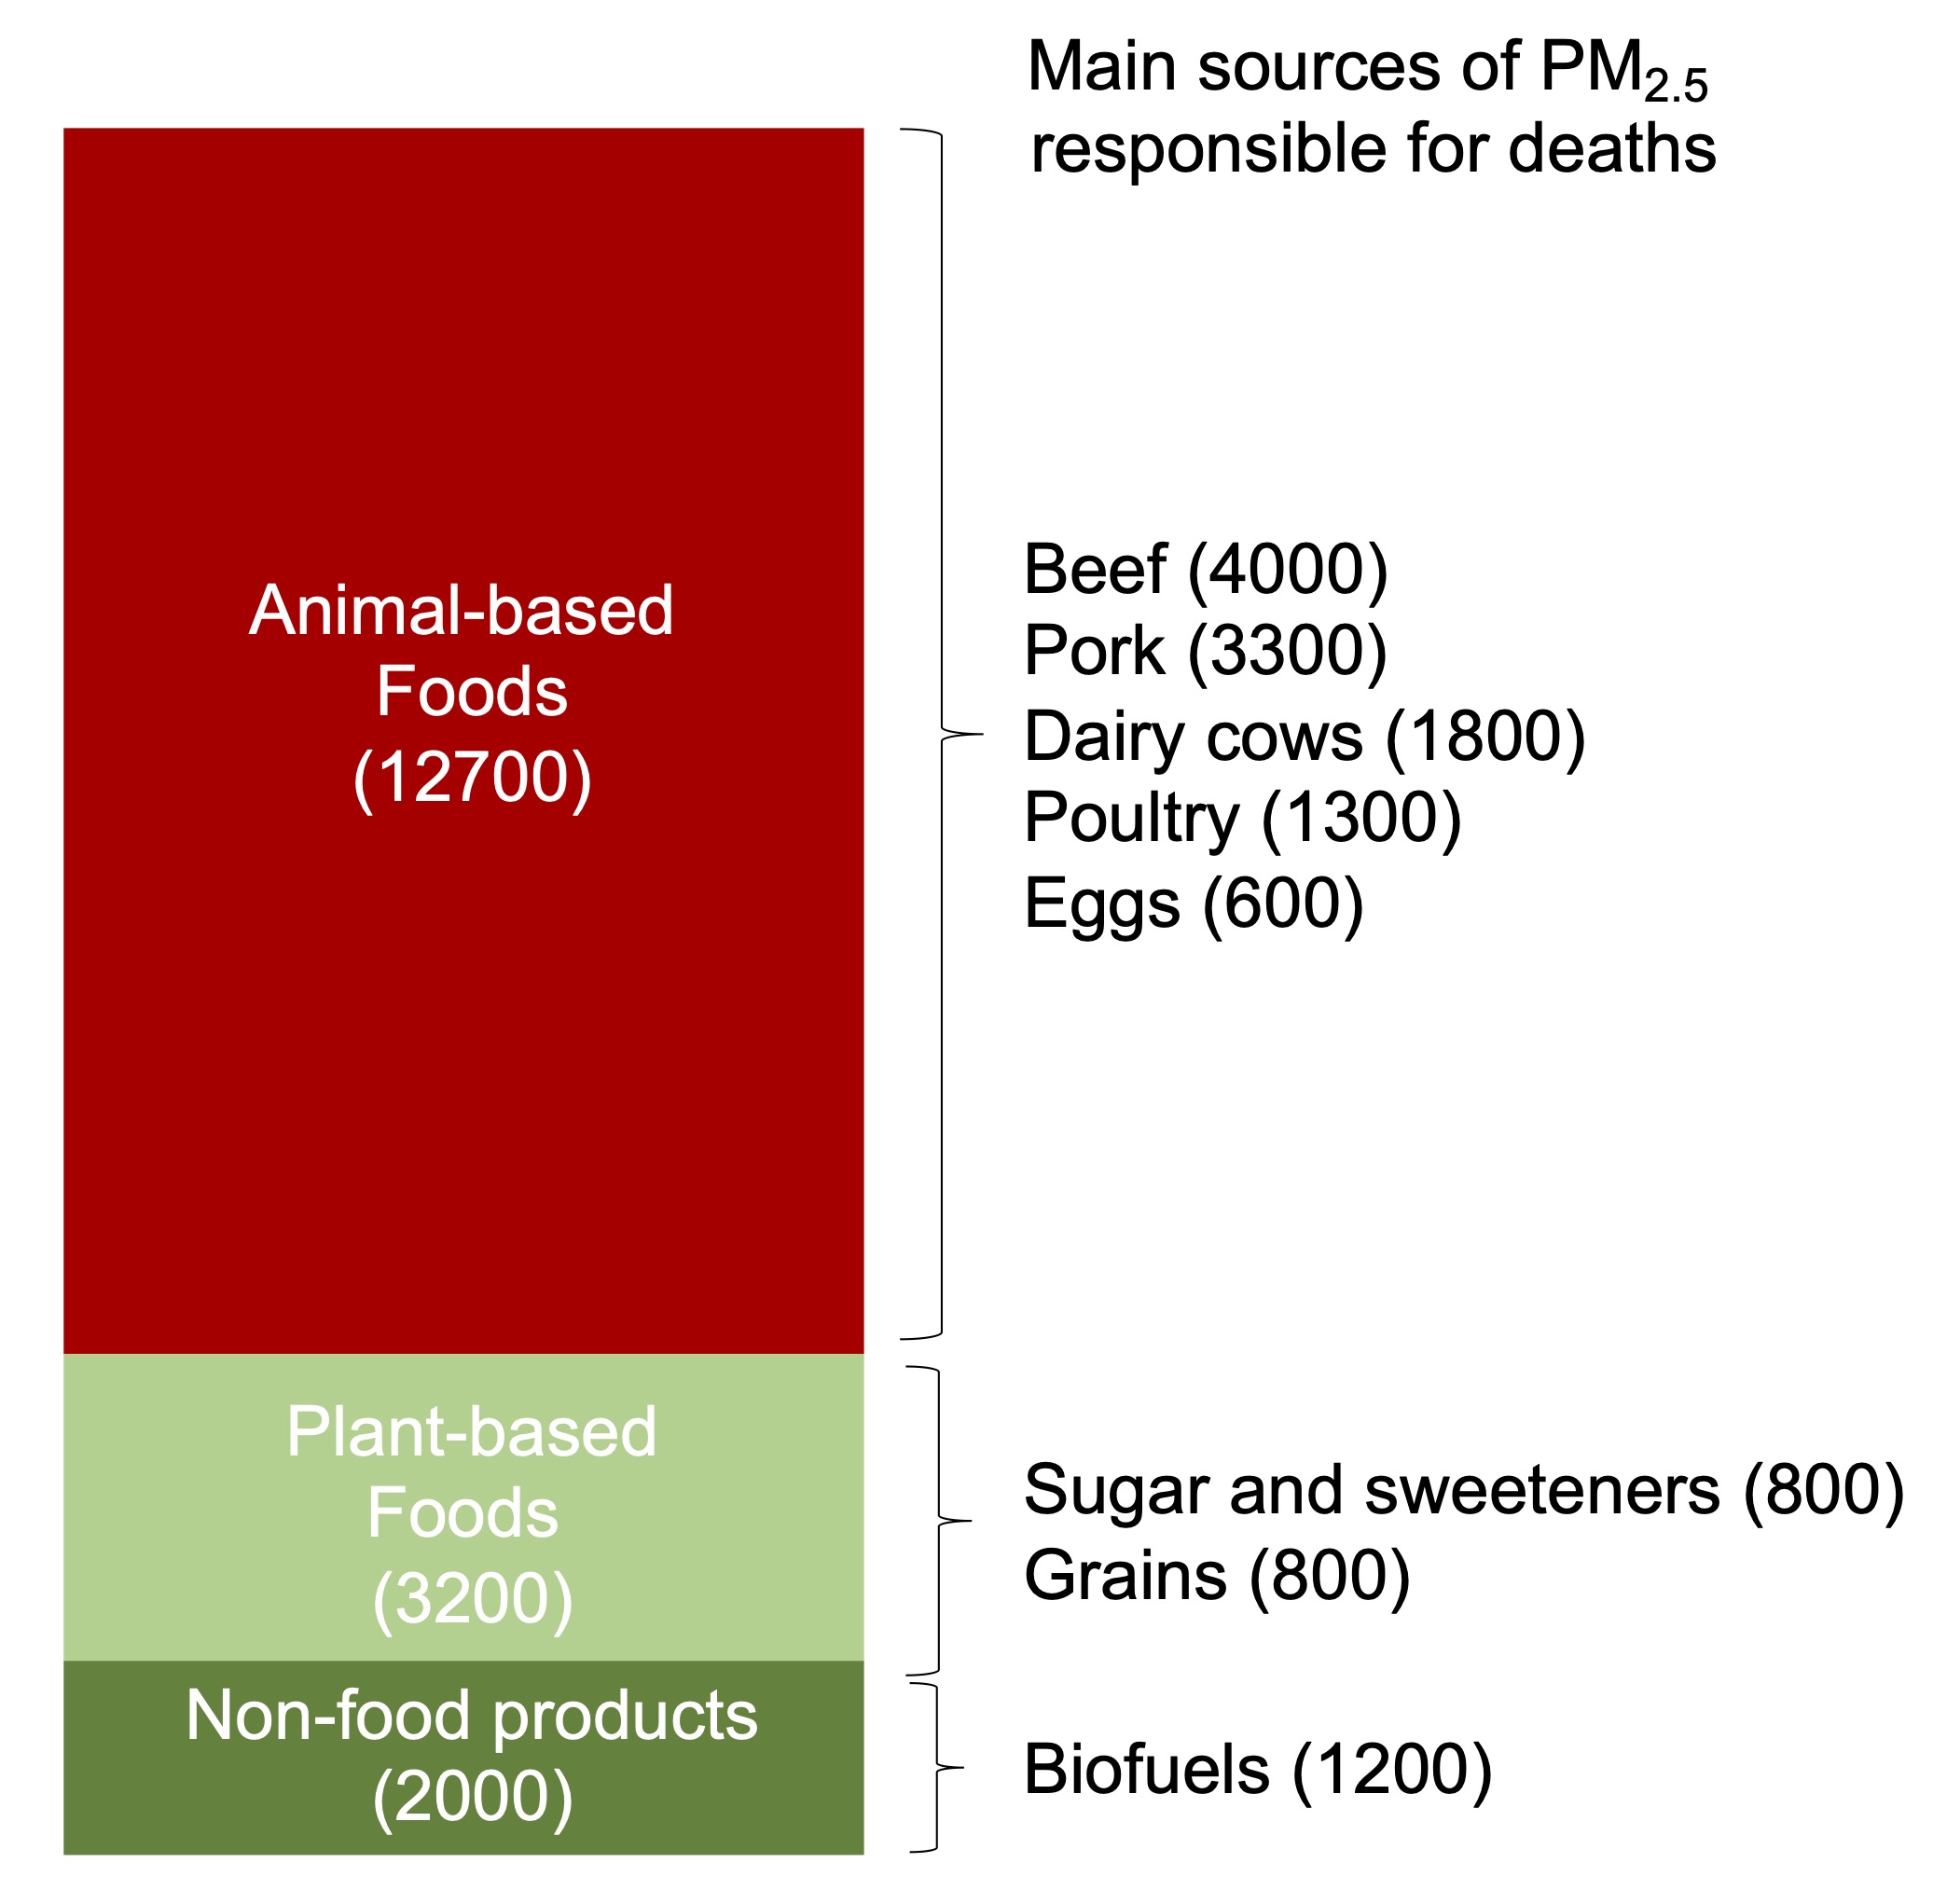
Figure 8. Distribution of deaths caused annually by PM2.5 from the agricultural sector in the United States. Note that 70% of the mortality is attributable to livestock products, mainly due to the ammonia generated by the animals as well as by the spreading of manure, slurry and synthetic fertilizers for the cultivation of fodder plants (corn, soybeans). From Domingo et al. (2021).
When we compare the impact of different foods for the same quantity of product, we immediately see that the production of red meat is particularly damaging, being responsible for at least 5 times more deaths than that of poultry, 10 times more than that of nuts and seeds, and at least 50 times more than that of other plants such as fruits and vegetables (Figure 9).
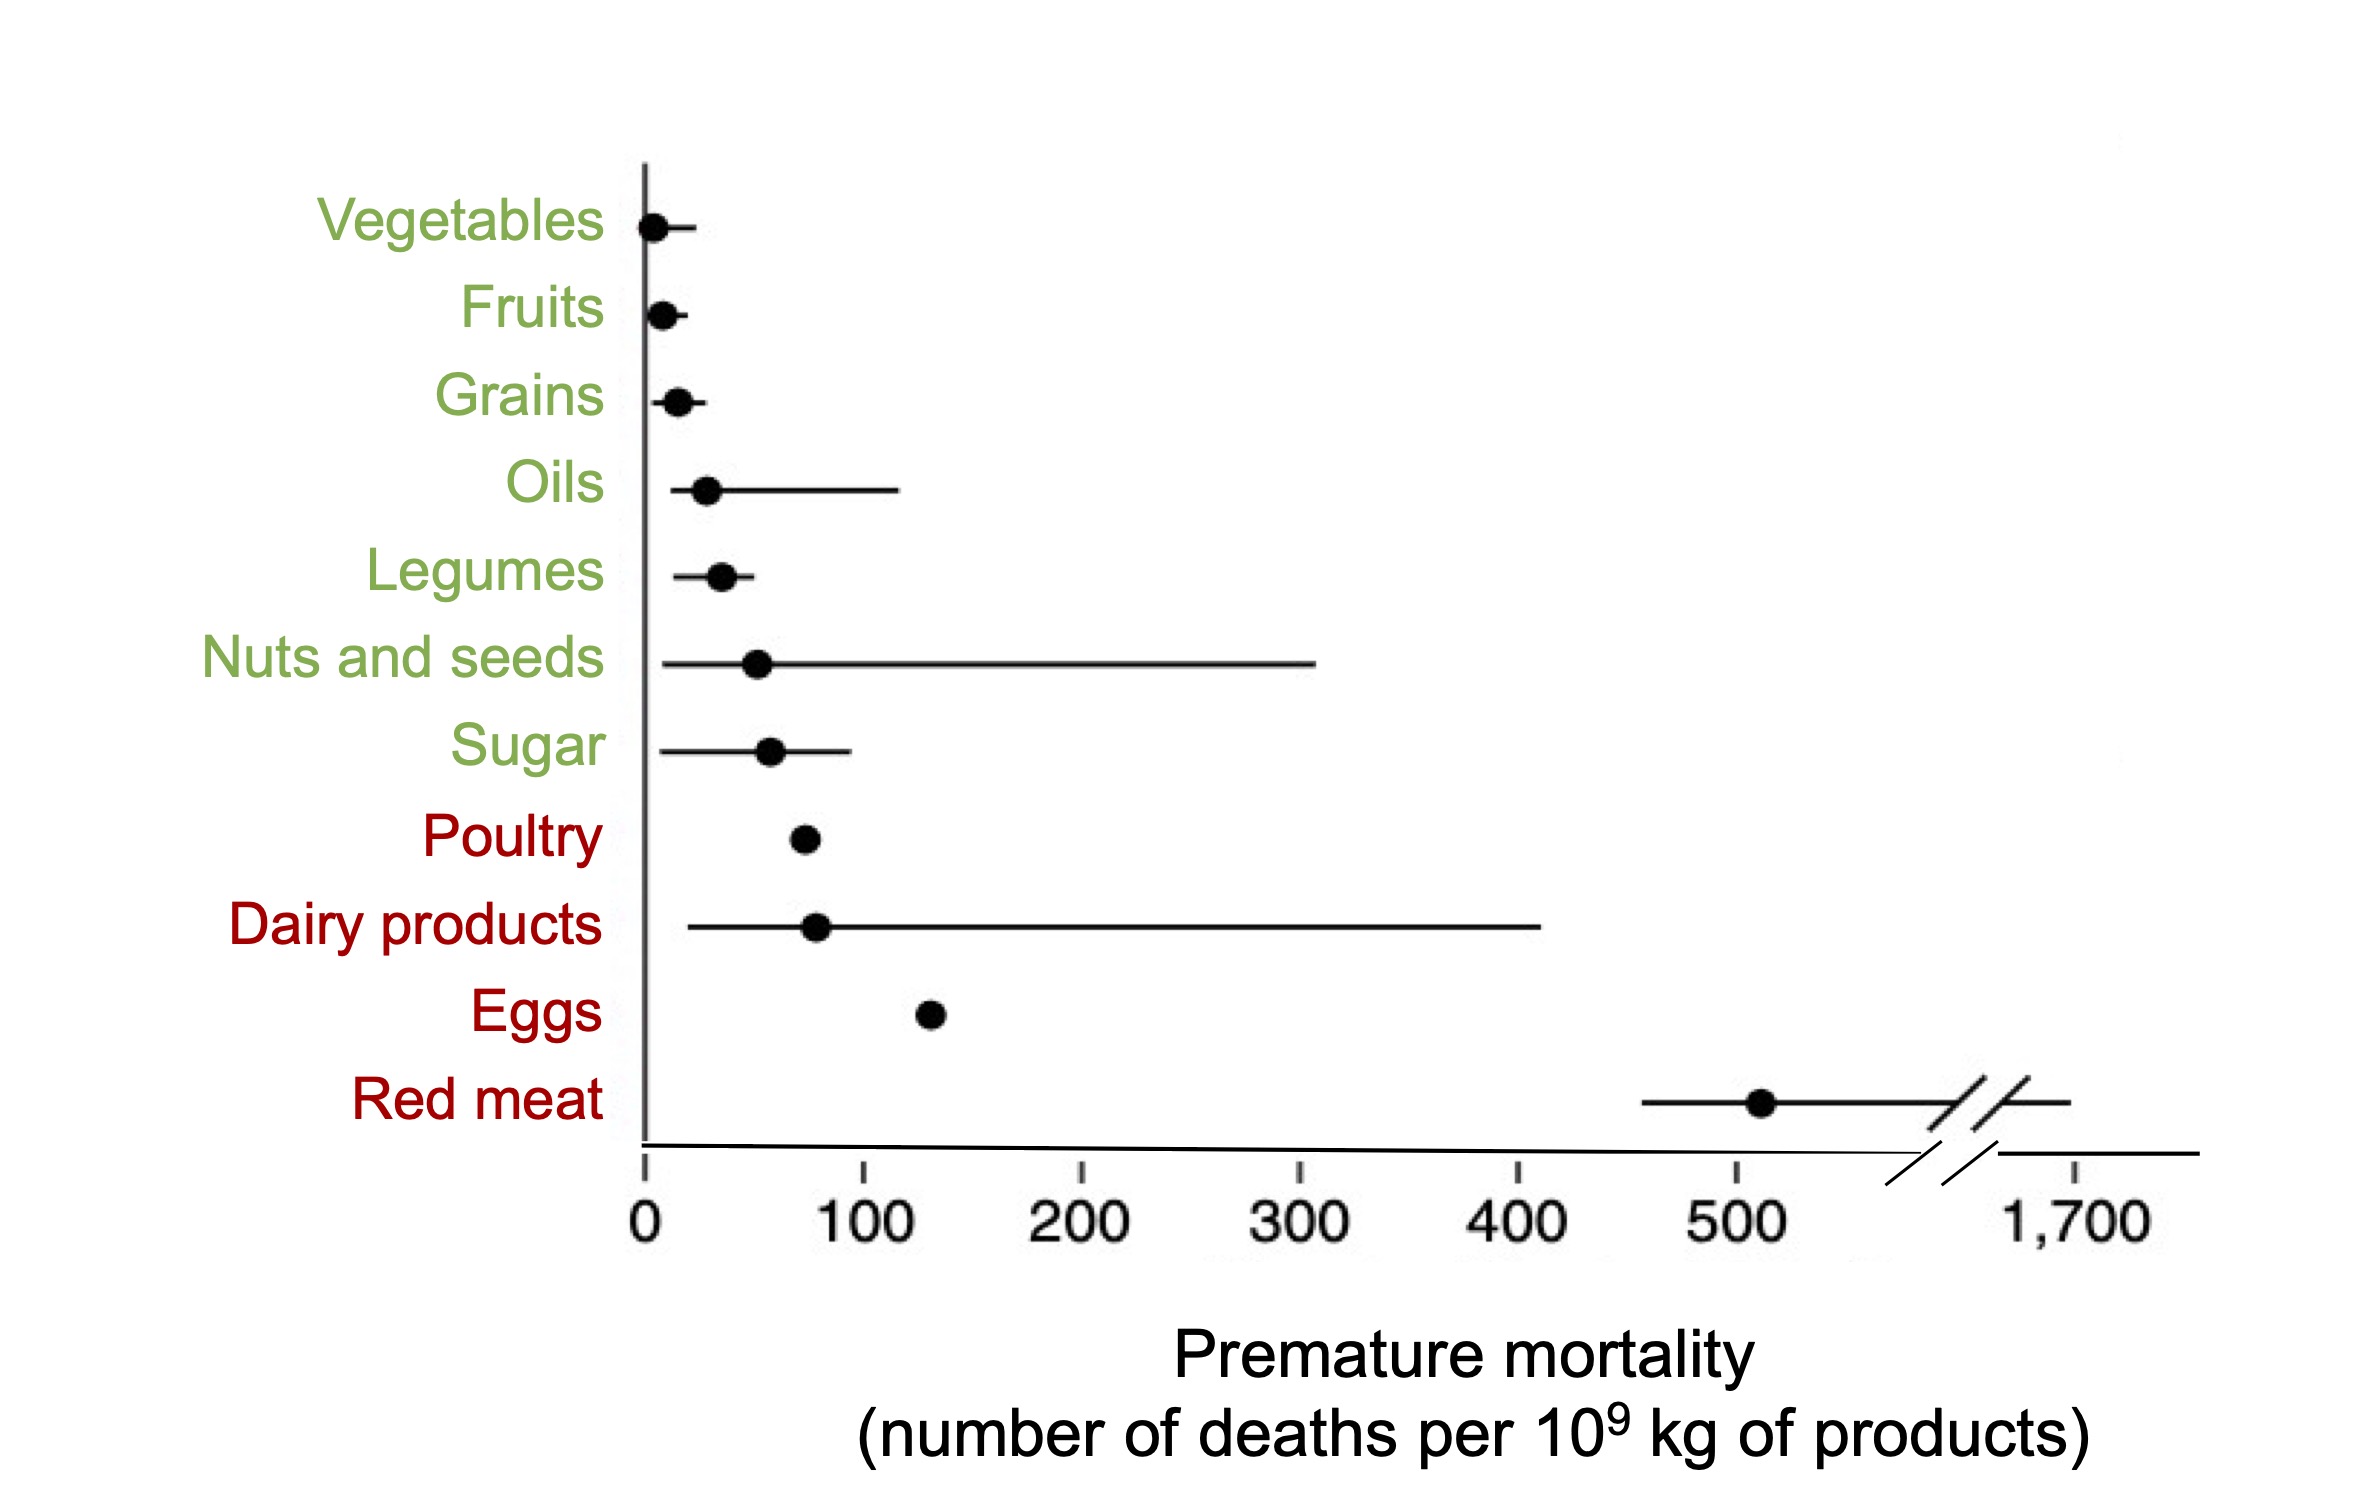
Figure 9. Comparison of PM2.5-related mortality by food types. From Domingo et al. (2021).
In short, whether in terms of reducing GHG emissions or health problems associated with atmospheric pollution, all the studies unequivocally show that a reduction in environmental damage caused by food production necessarily involves a reduction in the consumption of products of animal origin, in particular those from cattle farming. A change that is all the more profitable as the reduction in the intake of food of animal origin, combined with an increase in the consumption of plants, is beneficial for health and could prevent about 11 million premature deaths annually, a decrease of 20%.